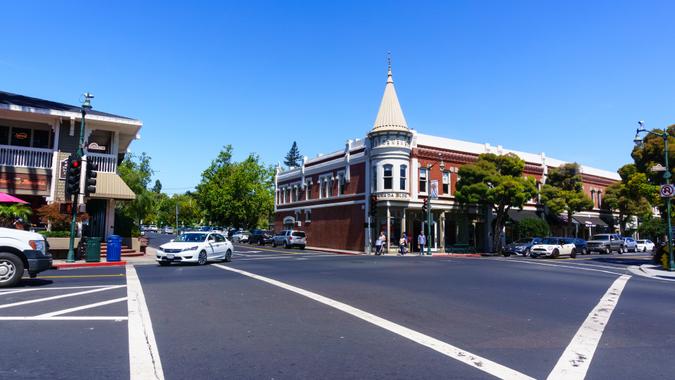
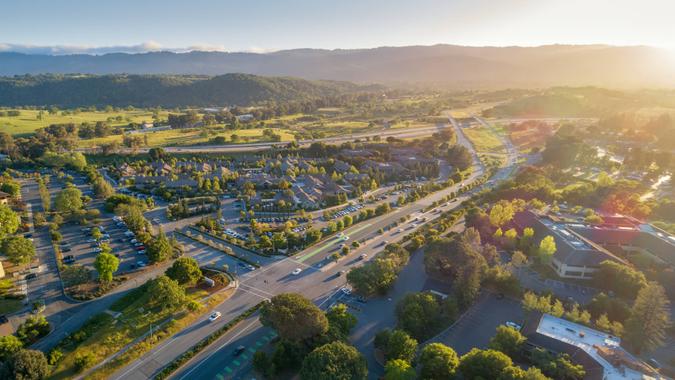
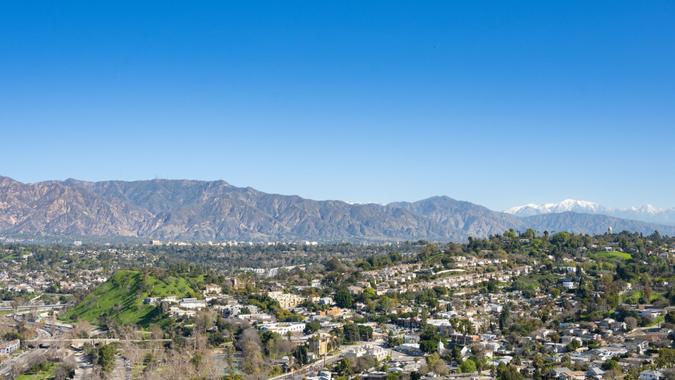
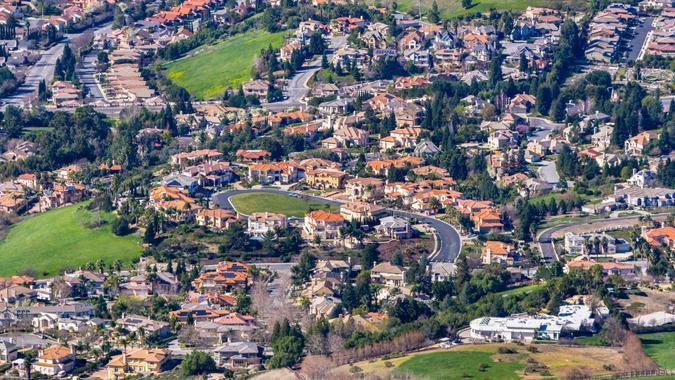
High-net-worth individuals might want to consider relocating to one of these 23 California cities considered to be among the safest and richest in the nation.
See More: GOBankingRates Original Research Center
View Next: 7 Tax Loopholes the Rich Use To Pay Less and Build More Wealth
This data was provided via a 2025 GOBankingRates original study ranking America’s safest and richest cities to live in. We found these cities by identifying the top 1,000 cities with the highest average income and collecting additional data, such as the average home value, cost of living and property and violent crime rates. From the total list of 100 cities, 23 are based in California.
Keep reading to see which California cities made the list — and check out the 50 safest and richest U.S. cities to live in this year.

Mill Valley
- Average household income: $308,154
- Average home value: $2,111,866
- Total cost of living annually: $176,163
- Property crime rate (per 1,000): 7.983
- Violent crime rate (per 1,000): 0.503
Try This: 4 Moves To Make if You Can’t Pay All Your Bills this Month
Learn More: Here’s Why You Always Want to Know Your Net Worth, According to a Financial Expert

Lafayette
- Average household income: $319,744
- Average home value: $1,945,074
- Total cost of living annually: $165,358
- Property crime rate (per 1,000): 12.459
- Violent crime rate (per 1,000): 0.804
Find Out: Here’s the Best Way to Manage Money As a Couple, According to Emma Johnson

Ross
- Average household income: $443,802
- Average home value: $3,688,053
- Total cost of living annually: $287,093
- Property crime rate (per 1,000): 13.164
- Violent crime rate (per 1,000): 1.316

San Ramon
- Average household income: $235,524
- Average home value: $1,739,127
- Total cost of living annually: $151,253
- Property crime rate (per 1,000): 9.390
- Violent crime rate (per 1,000): 1.413

Cupertino
- Average household income: $295,739
- Average home value: $3,251,193
- Total cost of living annually: $256,938
- Property crime rate (per 1,000): 12.196
- Violent crime rate (per 1,000): 1.040
Read Next: How Do You Know When You’re Financially Ready to Have a Child?

Kensington
- Average household income: $258,725
- Average home value: $1,487,688
- Total cost of living annually: $133,769
- Property crime rate (per 1,000): 20.327
- Violent crime rate (per 1,000): 0.598

Los Altos
- Average household income: $403,512
- Average home value: $4,503,419
- Total cost of living annually: $344,681
- Property crime rate (per 1,000): 10.376
- Violent crime rate (per 1,000): 0.901

Dublin
- Average household income: $237,655
- Average home value: $1,474,748
- Total cost of living annually: $132,533
- Property crime rate (per 1,000): 16.956
- Violent crime rate (per 1,000): 1.490
For You: Here’s the Best Way to Manage Money As a Couple, According to Emma Johnson

Saratoga
- Average household income: $344,319
- Average home value: $4,091,202
- Total cost of living annually: $316,331
- Property crime rate (per 1,000): 6.157
- Violent crime rate (per 1,000): 0.612
Los Gatos
- Average household income: $317,745
- Average home value: $2,748,787
- Total cost of living annually: $222,586
- Property crime rate (per 1,000): 17.083
- Violent crime rate (per 1,000): 1.411

Pleasanton
- Average household income: $238,593
- Average home value: $1,719,032
- Total cost of living annually: $149,197
- Property crime rate (per 1,000): 19.857
- Violent crime rate (per 1,000): 1.223
Be Aware: I Asked ChatGPT If a Recession Is Coming Soon — Here’s What It Said

Belmont
- Average household income: $258,184
- Average home value: $2,354,466
- Total cost of living annually: $195,182
- Property crime rate (per 1,000): 12.849
- Violent crime rate (per 1,000): 2.110

Livermore
- Average household income: $193,500
- Average home value: $1,191,837
- Total cost of living annually: $111,880
- Property crime rate (per 1,000): 19.349
- Violent crime rate (per 1,000): 2.297
Menlo Park
- Average household income: $339,415
- Average home value: $2,941,856
- Total cost of living annually: $235,615
- Property crime rate (per 1,000): 17.609
- Violent crime rate (per 1,000): 2.497
That’s Interesting: 8 Smart Ways Frugal People Are Living Like There’s Already a Recession

Morgan Hill
- Average household income: $199,024
- Average home value: $1,408,718
- Total cost of living annually: $128,900
- Property crime rate (per 1,000): 10.980
- Violent crime rate (per 1,000): 2.482

Sunnyvale
- Average household income: $245,990
- Average home value: $2,374,138
- Total cost of living annually: $194,940
- Property crime rate (per 1,000): 19.207
- Violent crime rate (per 1,000): 2.480
South Pasadena
- Average household income: $189,883
- Average home value: $1,801,768
- Total cost of living annually: $154,559
- Property crime rate (per 1,000): 27.992
- Violent crime rate (per 1,000): 1.498
Discover More: Here’s How Much Cash You Need Stashed To Survive a Recession in the Midwest
Fremont
- Average household income: $213,704
- Average home value: $1,670,291
- Total cost of living annually: $145,420
- Property crime rate (per 1,000): 28.608
- Violent crime rate (per 1,000): 2.156
Mountain View
- Average household income: $248,416
- Average home value: $2,469,719
- Total cost of living annually: $201,733
- Property crime rate (per 1,000): 28.439
- Violent crime rate (per 1,000): 2.538

Palo Alto
- Average household income: $308,837
- Average home value: $3,781,549
- Total cost of living annually: $293,985
- Property crime rate (per 1,000): 28.047
- Violent crime rate (per 1,000): 2.082
Trending Now: I’m an Economist — Here’s How Likely a Recession Is for the Second Half of 2025

Burlingame
- Average household income: $237,106
- Average home value: $2,804,966
- Total cost of living annually: $226,626
- Property crime rate (per 1,000): 26.507
- Violent crime rate (per 1,000): 2.118

Milpitas
- Average household income: $208,941
- Average home value: $1,618,276
- Total cost of living annually: $142,649
- Property crime rate (per 1,000): 33.863
- Violent crime rate (per 1,000): 3.213

Campbell
- Average household income: $206,906
- Average home value: $2,040,342
- Total cost of living annually: $172,398
- Property crime rate (per 1,000): 26.556
- Violent crime rate (per 1,000): 3.539
Discover more original studies and surveys in the GOBankingRates original research center.
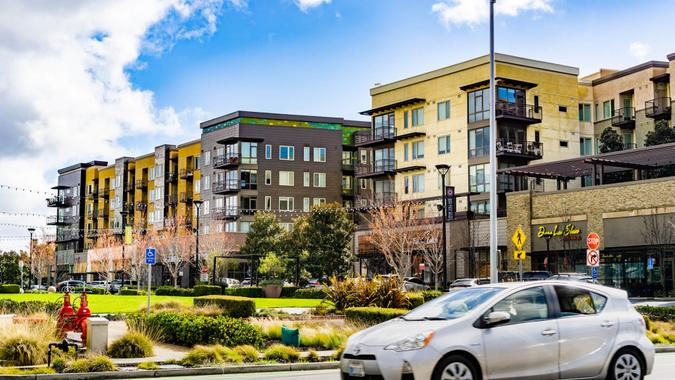
Editor’s note: Photos are for representational purposes only and might not reflect the exact locations listed.
Methodology: Using the U.S. Census American Community Survey, the 1,000 cities with the highest household mean income were identified. Total population, population ages 65 and up, total households, household median income and household mean income were sourced from the Survey. The average single-family home value was sourced from Zillow Home Value Index for May 2025. The cost-of-living indexes were sourced from Sperling’s BestPlaces and national average expenditure costs for all households were sourced from the Bureau of Labor Statistics Consumer Expenditure Survey. Using data from the Federal Bureau of Investigation’s Crime Data Explorer, the number of property crimes and violent crimes reported were sourced for each location. The property crime rate per 1,000 residents and the violent crime rate per 1,000 residents were both calculated. The livability index was sourced from AreaVibes and any location with a livability index below 80 was removed for this study as it represents a location with a lower quality of life. The total average cost of living was scored and weighted at 1.00, the property crime rate per 1,000 was scored and weighted at 1.00, the violent crime rate per 1,000 residents was scored and weighted at 1.00, the household mean income was scored and weighted at 1.00, and the livability index was scored and weighted at 1.00. All data was collected on and is up to date as of Aug. 4, 2025.
More From GOBankingRates
This article originally appeared on GOBankingRates.com: 23 Safest and Richest California Cities To Live in 2025