
Looking for a New York City suburb that combines wealth with peace of mind? GOBankingRates has ranked the 20 safest and richest NYC suburbs for 2025 — locales where high household incomes meet low crime rates and high livability.
Also See: These Are America’s 50 Wealthiest Suburbs in 2025
Learn More: These Cars May Seem Expensive, but They Rarely Need Repairs
Using the latest data from the U.S. Census, the FBI, Zillow and other sources, GBR’s list reveals some of the metro area’s most desirable communities. Whether you’re prioritizing financial stability, personal safety or a higher quality of life, these suburbs check all the boxes.
The suburbs in the list are split closely between Westchester County and Nassau County. Westchester County places 11 suburbs in the list to Nassau County’s nine, but Nassau County boasts the top four.
Here’s a countdown from No. 20 to No. 1. For each suburb, we’ve included livability scores from AreaVibes, crime rates, average household incomes and average annual living costs.
Also see America’s wealthiest suburbs.

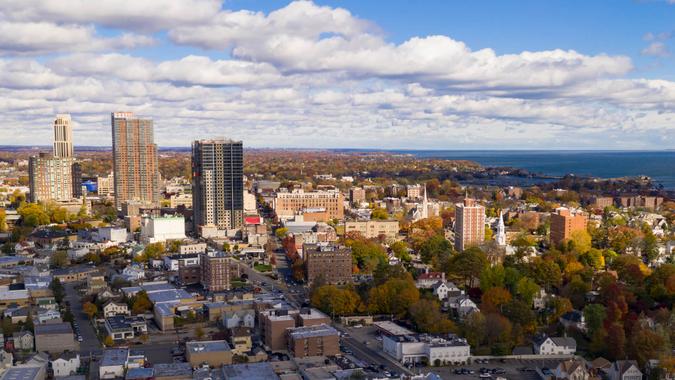
20. Yonkers
- Livability: 67
-
Crime rate (per 1,000):
- Violent: 3.12
- Property: 10.15
- Average household income: $110,907
- Annual cost of living: $82,151
Yonkers is located directly north of the Bronx, in Westchester County and along the eastern bank of the Hudson River. With about 210,000 residents, Yonkers is by far the most populous suburb in GBR’s top 20. Its mean household income is the third lowest among locales in the list.
Explore More: The 7 Best Retirement Towns You’ve Never Heard Of (but Should Consider in 2025)
Check Out: America’s 50 Most Expensive Retirement Towns

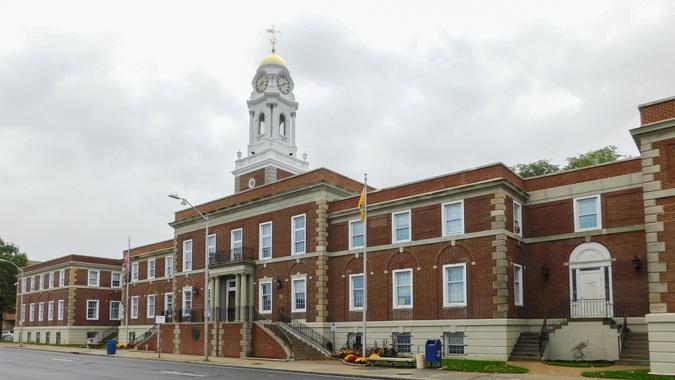
19. White Plains
- Livability: 71
-
Crime rate (per 1,000):
- Violent: 1.11
- Property: 17.60
- Average household income: $164,273
- Annual cost of living: $89,924
You’ll find White Plains in Westchester County, about 25 miles north of Midtown Manhattan. White Plains’ ranking in the top 20 is hurt by its relatively high property crime rate — the highest among suburbs in the list.
Explore More: The Wealthiest Suburb in Each of America’s 50 Largest Metro Areas
18. Hempstead
- Livability: 78
-
Crime rate (per 1,000):
- Violent: 4.59
- Property: 10.98
- Average household income: $112,145
- Annual cost of living: $75,803
Hempstead sits on Long Island in Nassau County. Its annual cost of living is the second lowest among suburbs in this list. Hempstead also has the lowest percentage of residents age 65+ in the top 20, just 12.7%.
17. New Rochelle
- Livability: 70
-
Crime rate (per 1,000):
- Violent: 1.34
- Property: 11.05
- Average household income: $166,757
- Annual cost of living: $99,515
New Rochelle is located in Westchester County, along the Long Island Sound. It has the eighth-highest average value for single-family homes in GBR’s top 20. New Rochelle’s average monthly expenditures ($2,567) rank sixth lowest.

16. Glen Cove
- Livability: 65
-
Crime rate (per 1,000):
- Violent: 1.12
- Property: 4.68
- Average household income: $123,790
- Annual cost of living: $85,873
Glen Cove sits along the North Shore of Long Island in Nassau County. With an AreaVibes livability score of 65, Glen Cove ranks last among the suburbs in the top 20. Its property crime rate ranks sixth lowest.

15. Port Chester
- Livability: 72
-
Crime rate (per 1,000):
- Violent: 0.76
- Property: 9.65
- Average household income: $134,151
- Annual cost of living: $80,839
Port Chester is located in the eastern part of Westchester County on the border with Connecticut. Among suburbs in this list, Port Chester has the lowest average monthly expenditures ($2,390). Its violent crime rate is the sixth lowest in the list.
Find More: Here’s the Minimum Salary Required To Be Considered Upper Class in 2025
14. Peekskill
- Livability: 76
-
Crime rate (per 1,000):
- Violent: 2.08
- Property: 9.73
- Average household income: $115,364
- Annual cost of living: $67,469
Peekskill sits along the eastern bank of the Hudson River in the northwestern part of Westchester County. It has the lowest annual cost of living among suburbs in the top 20.

13. Rye
- Livability: 70
-
Crime rate (per 1,000):
- Violent: 0.12
- Property: 2.55
- Average household income: $421,259
- Annual cost of living: $190,450
Rye sits along the Long Island Sound in southern Westchester County. Mortgages are expensive here, with Rye’s monthly average coming in at $13,216 — by far the highest among suburbs in the top 20. Rye also has the highest annual cost of living.

12. Mamaroneck
- Livability: 69
-
Crime rate (per 1,000):
- Violent: 0.08
- Property: 5.39
- Average household income: $184,151
- Annual cost of living: $111,077
You’ll find Mamaroneck in Westchester County, beside the Long Island Sound. Mamaroneck’s rating is helped by its low rate of violent crime, the third lowest in GBR’s top 20. Its property crime rate sits in the middle of the pack at No. 10.

11. Harrison
- Livability: 72
-
Crime rate (per 1,000):
- Violent: 0.06
- Property: 4.76
- Average household income: $258,737
- Annual cost of living: $135,541
Harrison is located in Westchester County, just north of the Bronx and close to the Connecticut border. Harrison’s violent crime rate — a minuscule 0.06 — is tied for the lowest among suburbs in the top 20. Its property crime rate ranks ninth lowest.

10. Port Washington
- Livability: 79
-
Crime rate (per 1,000):
- Violent: 1.26
- Property: 8.10
- Average household income: $249,834
- Annual cost of living: $118,631
Port Washington sits along the North Shore of Long Island in Nassau County. Port Washington’s mean household income ranks fifth among suburbs in GBR’s top 20. Its average single-family home value is the sixth highest.
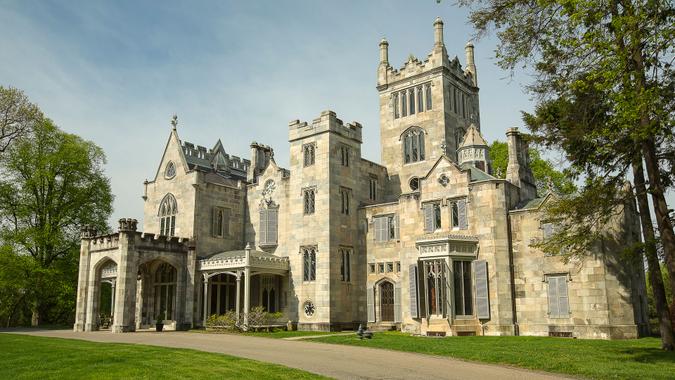
9. Tarrytown
- Livability: 70
-
Crime rate (per 1,000):
- Violent: 0.34
- Property: 4.12
- Average household income: $167,926
- Annual cost of living: $90,942
Tarrytown sits along the eastern bank of the Hudson River in Westchester County. With about 12,000 residents, Tarrytown is the least populous suburb among GBR’s top 20. Tarrytown is popular with the retired set — about 23% of those residents is age 65 or older.

8. Freeport
- Livability: 80
-
Crime rate (per 1,000):
- Violent: 1.63
- Property: 9.15
- Average household income: $141,297
- Annual cost of living: $77,531
Freeport is found in Nassau County on Long Island. The average cost of a monthly mortgage in Freeport comes in around $3,800, the third-lowest figure among suburbs in this list.
7. Eastchester
- Livability: 78
-
Crime rate (per 1,000):
- Violent: 0.20
- Property: 5.67
- Average household income: $209,817
- Annual cost of living: $120,646
Eastchester is located in Westchester County, just north of the Bronx. Eastchester’s average annual cost of living is the fifth highest in GBR’s top 20 list. Its violent crime rate is the fifth lowest.
Check Out: 10 Best Places on the East Coast To Retire With $500K in Savings

6. Floral Park
- Livability: 81
-
Crime rate (per 1,000):
- Violent: 1.27
- Property: 4.30
- Average household income: $195,150
- Annual cost of living: $91,413
Floral Park is located in Nassau County on western Long Island, near the border with Queens. Its livability score of 81 is good enough to tie for fourth highest among suburbs in the top 20. Floral Park’s average monthly expenditures are the seventh highest.

5. Scarsdale
- Livability: 69
-
Crime rate (per 1,000):
- Violent: 0.06
- Property: 3.41
- Average household income: $601,193
- Annual cost of living: $142,654
You’ll find Scarsdale just north of New York City in Westchester County. Scarsdale matches Harrison for the lowest violent crime rate among locales in the top 20. Scarsdale’s mean household income is the highest in the list, by far.

4. Garden City
- Livability: 84
-
Crime rate (per 1,000):
- Violent: 0.26
- Property: 7.88
- Average household income: $292,919
- Annual cost of living: $123,738
Garden City, located in Nassau County on western Long Island, has the third highest livability score in GBR’s top 20. Its mean household income is also the third highest.
Also Explore: 7 Cities With Homes Expected To Plummet in Value in the Second Half of 2025

3. Long Beach
- Livability: 81
-
Crime rate (per 1,000):
- Violent: 0.78
- Property: 1.04
- Average household income: $154,026
- Annual cost of living: $90,518
Long Beach sits along the South Shore of Long Island in Nassau County. Its livability score is tied for fourth best among suburbs in the top 20. Its average monthly expenditures ($2,800) are the highest in the list.
2. Lynbrook
- Livability: 86
-
Crime rate (per 1,000):
- Violent: 0.75
- Property: 4.71
- Average household income: $170,605
- Annual cost of living: $84,224
Lynbrook is located in Nassau County on the South Shore of Long Island. Lynbrook’s livability score is tied for the highest among suburbs in GBR’s top 20. Its average value for a single-family home ranks sixth lowest.

1. Rockville Centre
- Livability: 86
-
Crime rate (per 1,000):
- Violent: 0.24
- Property: 4.71
- Average household income: $202,529
- Annual cost of living: $101,463
Rockville Centre takes the top spot on the strength of its AreaVibes livability score (86, tied for first in GBR’s list), low rates of property and violent crime (both in the top 10), and a strong mean household income. Located in Nassau County on the South Shore of Long Island, Rockville Centre is home to about 26,000 residents. Its total annual cost of living ranks eighth out of the 20 suburbs listed.
Editor’s note: Photos are for representational purposes only and might not reflect the exact locations listed.
Methodology: For this study, GOBankingRates first identified suburbs of New York City using the U.S. Census American Community Survey. GBR defines a suburb as a location with at least 5,000 households located in a MSA that is not a principal city named in the MSA. With the suburbs identified, GOBankingRates used the same database to source total population, population ages 65 and over, total households and household median income. Cost-of-living indexes were sourced from Sperling’s BestPlaces. Using the cost-of-living indexes and national average expenditure costs (sourced from the Bureau of Labor Statistics Consumer Expenditure Survey for all consumer units), the average expenditure cost for each location was calculated. The average single-family home value was sourced from the Zillow Home Value Index for July 2025. Using the average single-family home value, assuming a 10% down payment, and using the most recent national average 30-year fixed mortgage rate (sourced from Federal Reserve Economic Data), the average mortgage was calculated. Using the average mortgage and average expenditure costs, the average cost of living was calculated. The livability index was sourced from AreaVibes and is used to determine quality of life, which includes proximity to police stations, fire stations and hospitals. Rates of property crime and violent crime were sourced from the Crime Data Explorer from the Federal Bureau of Investigation. The violent crime rate per 1,000 was scored and weighted at 1.00, the property crime rate was scored and weighted at 1.00, the cost of living for necessities was scored and weighted at 1.00, the livability index was scored and weighted at 1.00, and the mean household income was scored and weighted at 1.00. All the scores were summed and sorted to show the safest and richest suburb in New York City. All data was collected on is up to date as of Sept. 7, 2025.
More From GOBankingRates
This article originally appeared on GOBankingRates.com: 20 Safest & Richest New York Suburbs in 2025