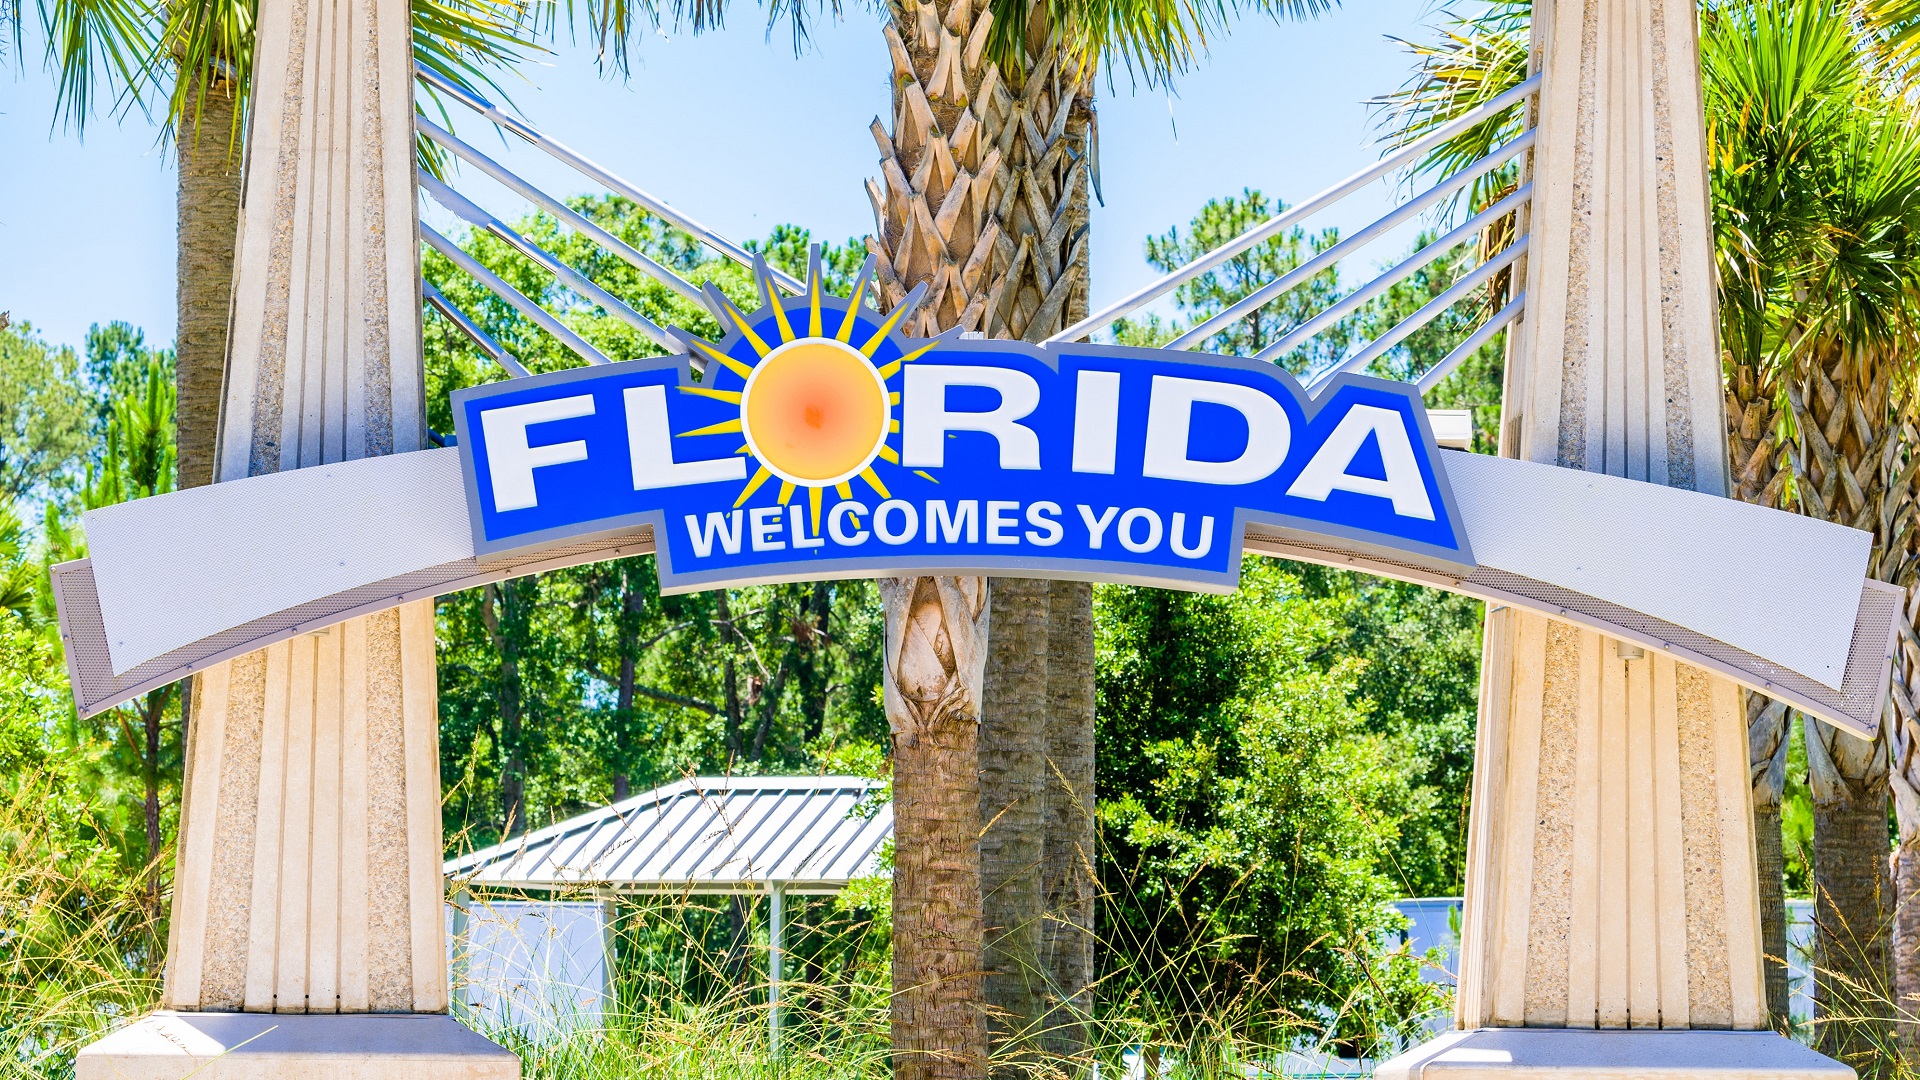
The shakiest U.S. housing markets heading into the new year? Florida certainly has its share.
Of the 20 most unstable housing markets in GOBankingRates’ latest list, the Sunshine State has 10 of them. That includes six of the top 10, along with the No. 1 entry in the list.
Check Out: The Safest and Richest US Cities To Live in 2025
Learn More: How Middle-Class Earners Are Quietly Becoming Millionaires — and How You Can, Too
To compile this list, GOBankingRates sourced August 2025 data from Zillow, evaluated 12 factors for each Metropolitan Statistical Area (MSA), then weighted various factors to produce rankings.
Values and projections listed here are from August 2024 and 2025, projecting to August 2026. Read on for the countdown, starting with the 20th shakiest market and ending with the shakiest.
Also see a few places where you are recommended to buy in 2026.

20. Sebastian, Florida
- 1-year home value projection: 0.5%
- 1-year home value change: -$22,459
- Share of listings with price cut in August: 21%
Home values in this city on Florida’s east coast stood at about $362,000 in August 2025, showing a decline of about $8,000 from the May 2025 numbers. Home values here are expected to recoup a bit of that value over the next year, but not much.
Find More: The Wealthiest Suburb in Each of America’s 50 Largest Metro Areas
Also See: Florida Home Prices Are Dropping Rapidly — Should You Buy While Prices Are Low?

19. Boulder, Colorado
- 1-year home value projection: -1.7%
- 1-year home value change: -$20,513
- Share of listings with price cut in August: 28%
Boulder homes had an average value of $717,000 in August, losing about $13,000 of value over the previous three months. Average values are projected to dip below $705,000 by August of next year.
Discover More: These Are America’s 50 Wealthiest Suburbs in 2025
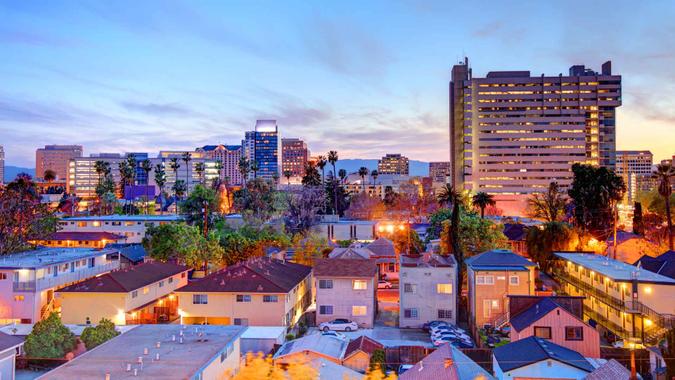
18. San Jose, California
- 1-year home value projection: 0.3%
- 1-year home value change: -$26,356
- Share of listings with price cut in August: 21%
San Jose’s average home value for August 2025 still comes in at a lofty $1.5 million. But values were down about 2% from the May numbers, which translates to a dollar loss of about $33,000.
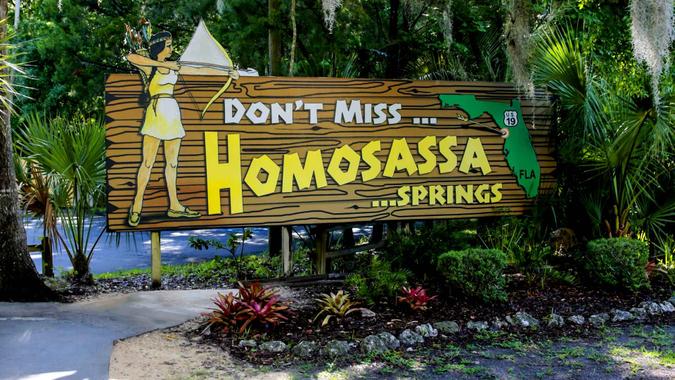
17. Homosassa Springs, Florida
- 1-year home value projection: 0.9%
- 1-year home value change: -$13,754
- Share of listings with price cut in August: 27%
Homosassa Springs is an unincorporated community in western Florida, about 75 miles north of Tampa. Average home values in Homosassa Springs dipped to about $275,000 in August, down from about $281,000 in May.

16. Phoenix
- 1-year home value projection: 0%
- 1-year home value change: -$16,761
- Share of listings with price cut in August: 34%
Phoenix homes shed a few thousand dollars of value on average between May and August of this year, winding up at $447,000. Values are projected to stay flat by August 2026.
Also Explore: 25 Places To Buy a Home If You Want It To Gain Value

15. Santa Rosa, California
- 1-year home value projection: -2.7%
- 1-year home value change: -$24,818
- Share of listings with price cut in August: 25%
The average home value in Santa Rosa came in at $793,000 last May, then dipped to $780,000 by August. Values are projected to drop below $760,000 by next August.

14. Crestview, Florida
- 1-year home value projection: -0.1%
- 1-year home value change: -$19,954
- Share of listings with price cut in August: 24%
Crestview homeowners lost about $7,000 in value on average between May and August 2025. Things are expected to flatten out between now and August 2026, however.

13. Denver
- 1-year home value projection: -1.3%
- 1-year home value change: -$16,549
- Share of listings with price cut in August: 37%
Denver’s share of listings with price cuts sits at 37% — the highest total among cities on GBR’s list. The average home value here in August was $579,000, with a predicted drop to $565,000 over the next year.

12. Dallas
- 1-year home value projection: -0.4%
- 1-year home value change: -$14,341
- Share of listings with price cut in August: 35%
The average home in Big D was valued at about $366,000 in August, down from $371,000 in May. Among cities in GBR’s list, Dallas has the second-highest percentage of listings with price cuts — about 35%.
Discover Next: How Much House Does $300K, $400K and $500K Buy You in Every State?
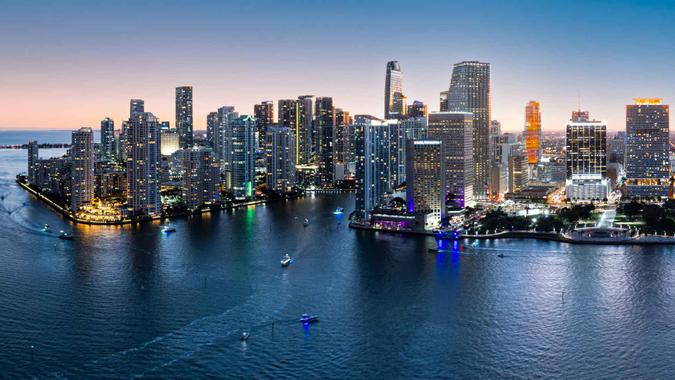
11. Miami
- 1-year home value projection: 1.5%
- 1-year home value change: -$21,120
- Share of listings with price cut in August: 21%
With average home values checking in around $473,000 in August, Miami homeowners lost around $10,000 in value on average over the previous three months. Those values are expected to increase by 1.5% percent by August of next year.

10. Deltona, Florida
- 1-year home value projection: -0.2%
- 1-year home value change: -$18,458
- Share of listings with price cut in August: 29%
You’ll find Deltona about 30 miles north of Orlando. Average home values in Deltona came in around $330,000 in August, down by around $6,000 compared to the May figures.

9. Houma, Louisiana
- 1-year home value projection: -7.9%
- 1-year home value change: -$9,021
- Share of listings with price cut in August: 22%
Houma, located about 60 miles southwest of New Orleans, has the lowest average home values in the list (about $181,000 in August). Those values are projected to drop significantly by next August — to about $167,000.

8. San Francisco
- 1-year home value projection: -3%
- 1-year home value change: -$43,485
- Share of listings with price cut in August: 22%
Homes in San Francisco lost about $24,000 in value on average between May and August. Average home prices are projected to drop down to near $1 million by August of next year.
7. Tampa, Florida
- 1-year home value projection: 0.2%
- 1-year home value change: -$23,309
- Share of listings with price cut in August: 33%
Tampa homeowners lost about $8,000 in value on average between May and August of this year. Values are projected to tick up slightly (about 0.2%) by August of next year.

6. Austin, Texas
- 1-year home value projection: -2.4%
- 1-year home value change: -$26,909
- Share of listings with price cut in August: 31%
The average value of a home in Austin landed at around $433,000 in August, down from about $443,000 in May. The slide is expected to continue. Projected values for August 2026 come in at $423,000.

5. Naples, Florida
- 1-year home value projection: 1.3%
- 1-year home value change: -$45,703
- Share of listings with price cut in August: 17.8%
Homeowners in Naples lost around $17,000 in value on average between May and August of this year. They are expected to recoup about 1.3% in value by August 2026.

4. North Port, Florida
- 1-year home value projection: -0.8%
- 1-year home value change: -$39,851
- Share of listings with price cut in August: 27%
North Port homeowners lost about $13,000 in value on average between May and August. They are expected to see values dip below $405,000 by next August.
Read More: 10 Best Places To Buy a Short-Term Rental Property To Earn Passive Income in 2025

3. Cape Coral, Florida
- 1-year home value projection: -1%
- 1-year home value change: -$38,384
- Share of listings with price cut in August: 21%
Cape Coral’s average home value in August came in just shy of $345,000 — a loss of about $13,000 (or 3.7%) over the numbers for May. Average home values are projected to dip below $342,000 by August 2026.

2. Kahului, Hawaii
- 1-year home value projection: 0.4%
- 1-year home value change: -$64,988
- Share of listings with price cut in August: 19%
Kahului homeowners lost $31,000 in value on average between May and August this year. Mean price cuts on listings came in at around $78,000 — the highest total among the cities in the list.
1. Punta Gorda, Florida
- 1-year home value projection: -2.4%
- 1-year home value change: -$42,408
- Share of listings with price cut in August: 23%
Based on GOBankingRates’ analysis, Punta Gorda is the shakiest housing market heading into the new year. This southwestern Florida city had an average home value of just under $305,000 in August, which meant a 5% loss in value over the previous three months and a 12% loss over the past year. Average home values are projected to dip below $300,000 by August 2026.
Methodology: GOBankingRates analyzed the 300 largest Metropolitan Statistical Areas (MSAs) to identify the weakest housing markets in the U.S., using Zillow’s August 2025 dataset. The study evaluated 12 key indicators for each MSA, including short- and long-term changes in home value, projected home value trends, inventory, average time from listing to pending and from pending to close, list-to-sale ratios and pricing dynamics such as the share of listings with price cuts and the average size of those cuts. To emphasize market instability and pricing pressure, four factors — 3-month and 1-year changes in home value (both percentage and dollar), share of listings with a price cut, and average price cut — were weighted twice as heavily in the scoring model, while inventory was weighted at half strength. Each MSA received a composite score, with higher scores indicating weaker market conditions. All data was collected on Oct. 7, 2025.
More From GOBankingRates
This article originally appeared on GOBankingRates.com: 20 Housing Markets on Shaky Ground Heading Into 2026


