What’s for dinner? Meatloaf!
You might be picturing an iconic scene from The Rocky Horror Picture Show, Will Ferrell in Wedding Crashers screaming “Ma, the meatloaf!” as he entertained new friends, or the singer Meat Loaf, born as Marvin Lee Aday.
That singer will be forever known for his hit “Two Out of Three Ain’t Bad.” And it turns out that’s exactly what I think right now about the trio of uber-large-cap stocks leading the S&P 500 Index ($SPX) and the Nasdaq-100 Index ($IUXX).
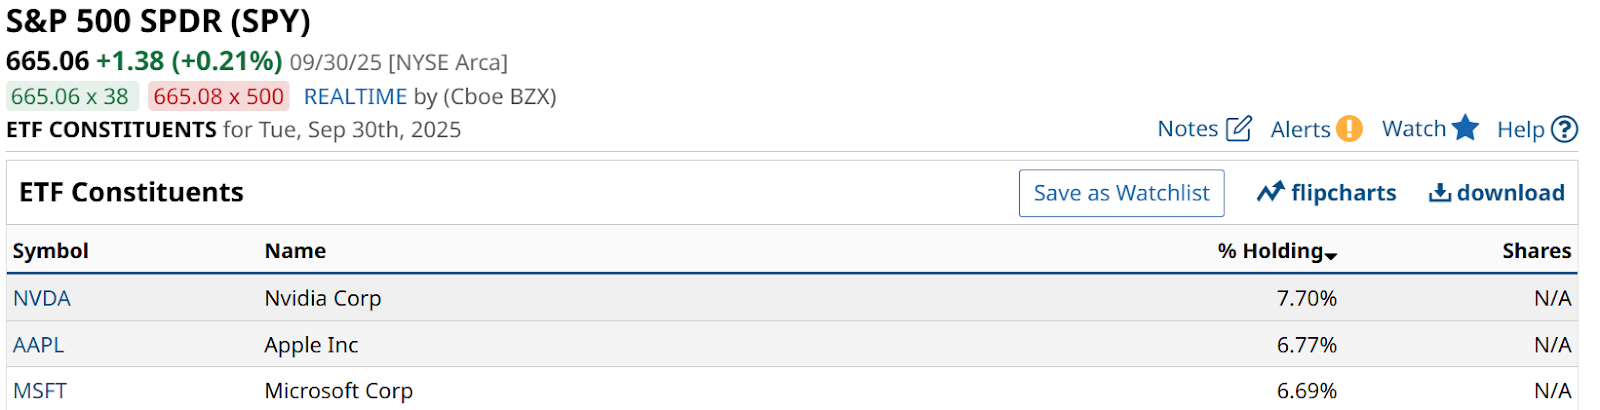
These three stocks – Nvidia (NVDA), Apple (AAPL), and Microsoft (MSFT) – account for more than 21% of the SPDR S&P 500 Trust ETF (SPY) and more than 26% of the Invesco QQQ ETF (QQQ). This is unprecedented in investing history.
Other global stock markets may be this concentrated, but the U.S. is breaking dot-com era records in this regard.
Based on their charts, in a swing-trader’s time frame, they each appear a bit differently to me. Here they are in order of near-term attractiveness. As a reminder, I focus on risk first, second, and third. In other words, I use the chart to take my belief that any stock can go up at any time, and separate one potential trade from another by asking “how much risk am I taking to pursue that upside?”
NVDA Stock Is Charging Toward $5 Trillion
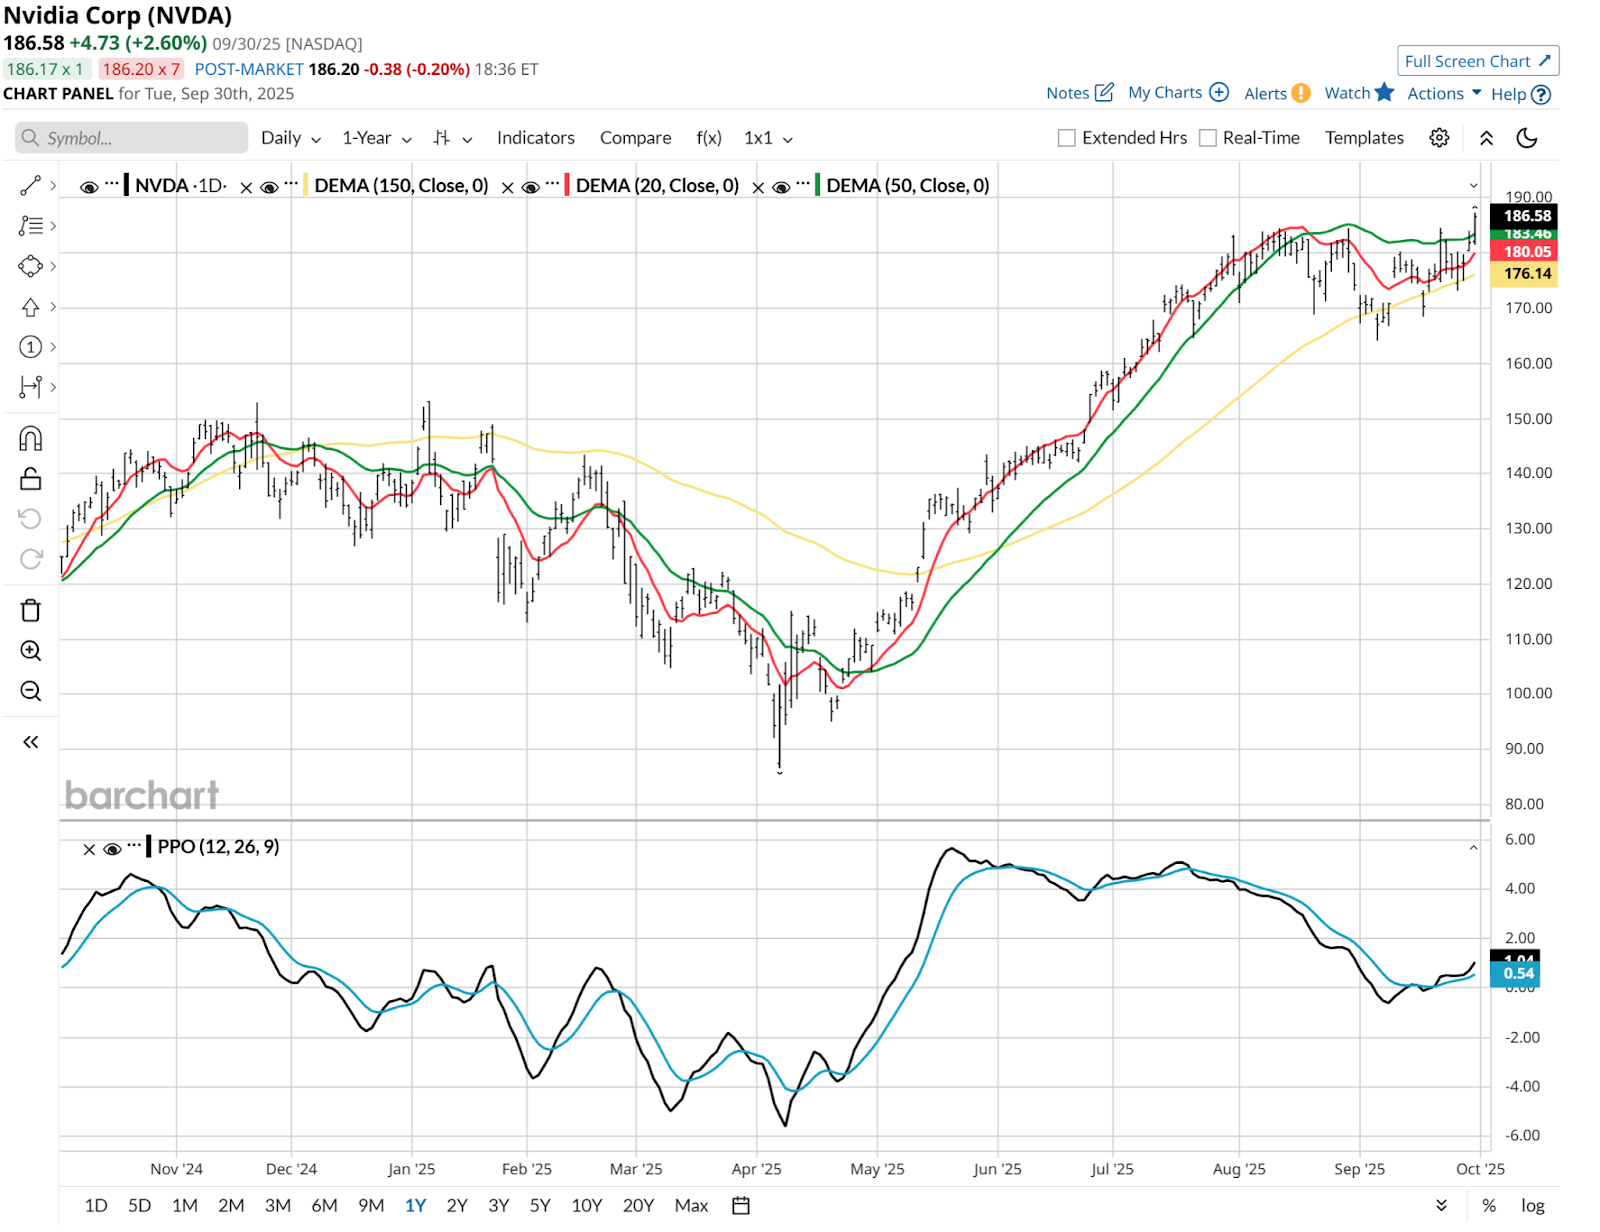
First, here’s Nvidia. I chart the entire S&P 500 each week, but I start with the 20 largest by market capitalization. This is the biggest, now at around $4.5 trillion. And I can’t believe I’m even writing that. But such are the times we live in.
I see a stock doing its best to make a dash toward an even $5 trillion in market cap. That Percentage Price Oscillator (PPO) at the bottom section is crossing up nicely into positive territory. And the 20-day moving average up top in red is making a similar move. NVDA just hit another all-time high, and let’s face it, the broad market probably needs this stock to go up in order to continue this manic S&P 500 runup that began back in April.
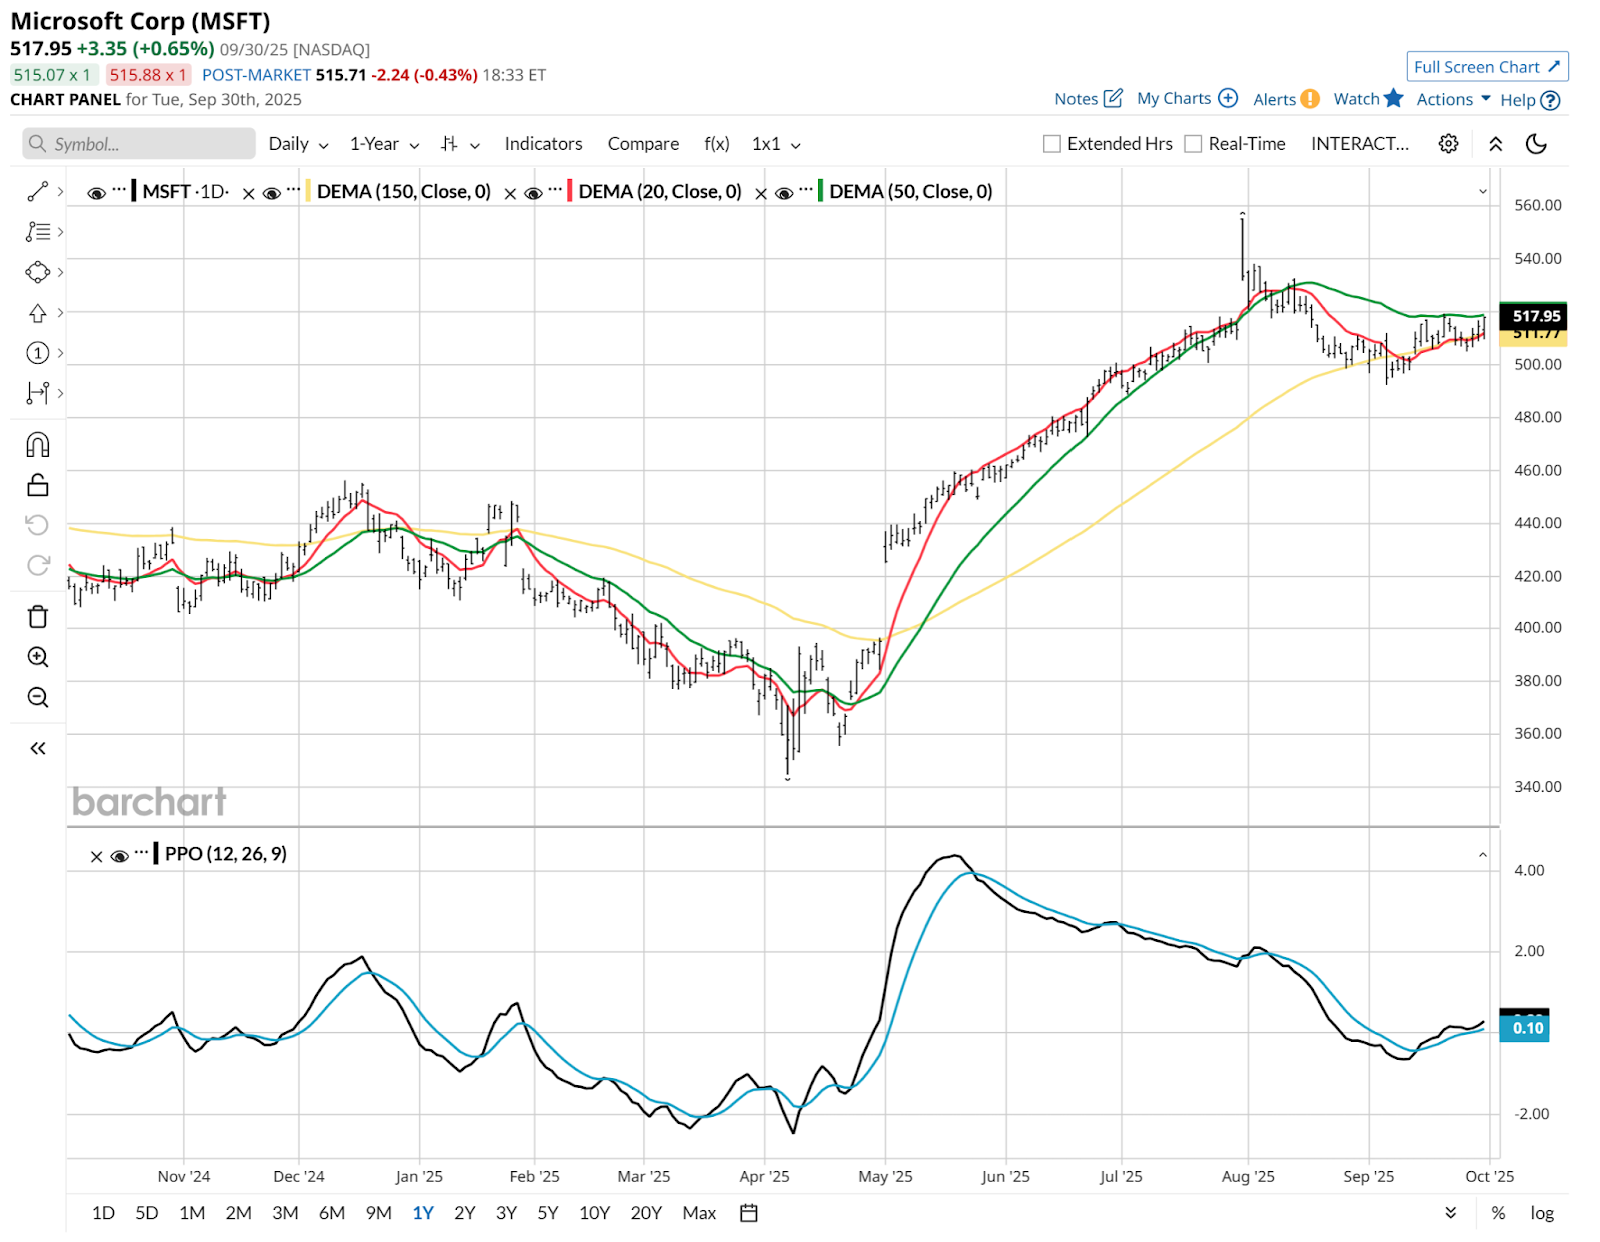
Microsoft’s Chart That Looks a Lot Like Nvidia’s
As for Microsoft, the second largest by market cap, it shows a similar pattern, albeit still 7% below its all-time high. It makes sense that these two stocks move in sync, given all of the index money chasing them.
Apple Is Not Worth Taking a Bite Out of Here
And as for Apple, it does not have the AI-driven frenzy that drives NVDA and MSFT these days. And the third largest stock by market cap may have just shown us its last big up move for a while, after a 25% rise during the just-completed third quarter.
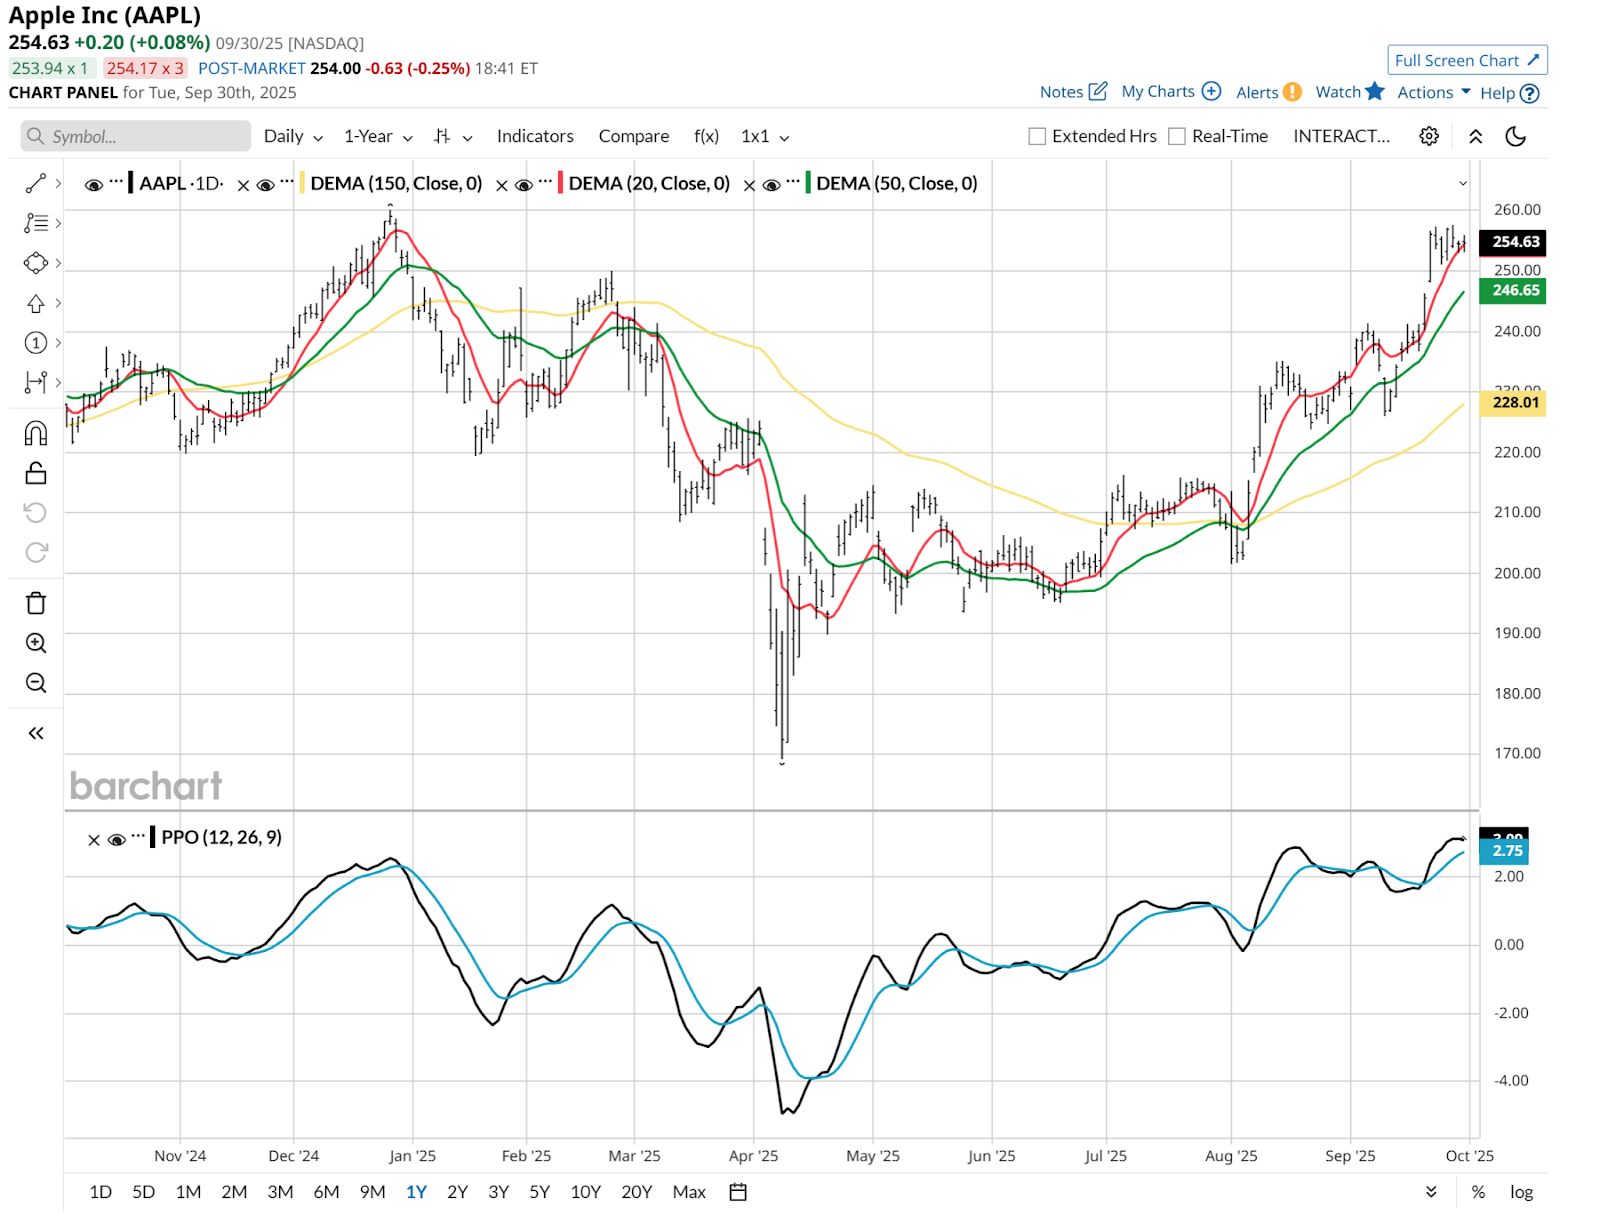
In summary, NVDA and MSFT look promising for further gains, while AAPL appears to me to have more risk. Like the big man sang back in the 1970s, “two out of three ain’t bad.”
All Revved Up with a Collar to Go
We can collar anything we want, as long as we can foot the bill for owning 100 shares of the underlying stock. In the case of NVDA, that means holding about $18,650 worth of stock (100 shares) as of Tuesday’s close. Here’s a collar example that aims to capitalize on a possible 10% move toward $5 trillion, but protecting below that recent low around $165. Let’s see what the Barchart.com options tables point me to.
I was looking for a 2:1 upside/downside opportunity, which is tougher to find than it has been in a while. That’s thanks to an IV Rank of 14%, which means that over the past 12 months, NVDA has typically been much more volatile than it is now. That means cheap puts (good, since I’m paying for that) but cheap calls too (bad, since I’m not getting as much for capping my upside).
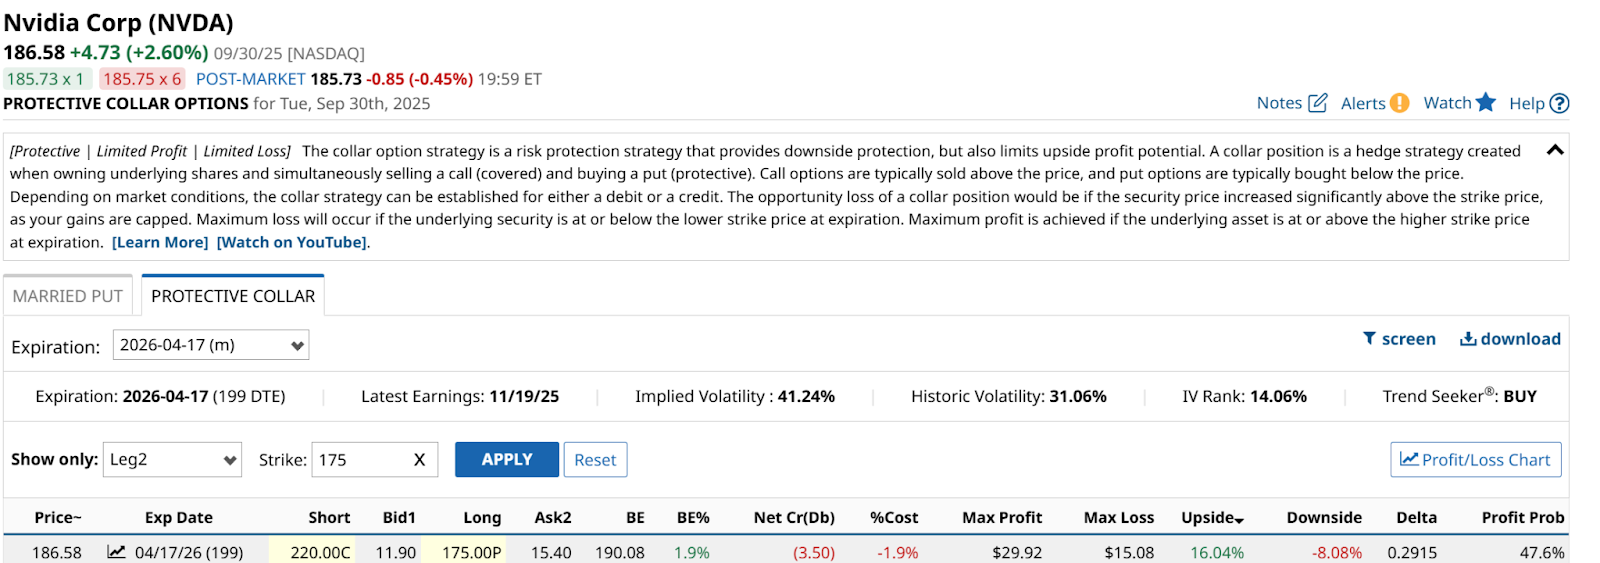
That all adds up to 16% upside, 8% downside, and a cost of under 2%. NVDA can go to around $5.3 trillion or so before I’m at risk of getting called. An option collar, with nice upside and low cost. As for the 8% downside risk, that’s a bit more than I prefer. But you know what they say. Two out of three ain’t bad!