The American Midwest, when compared to East and West coasts, is a relatively inexpensive place to live thanks in part to affordable housing and cost of living. With that in mind, just how long can you stretch paycheck in the Midwest’s biggest cities?
Also See: Are You Rich or Middle Class? 8 Ways To Tell That Go Beyond Your Paycheck
Learn More: 10 Used Cars That Will Last Longer Than the Average New Vehicle
To answer that question, GOBankingRates recently analyzed the 100 most populous American cities, as sourced from the U.S. Census Bureau, and then cross-referenced that with each city’s annual cost of living, as well the median household income.
Here is how much is left after necessities are covered in 10 of the Midwest’s biggest cities, with Minneapolis topping the list.
Also see 40 top cities where your paycheck goes furthest.

10. Fort Wayne, Indiana
- Median household income: $60,293
- Annual cost of necessities: $38,817
- What’s left: $21,476
In Fort Wayne, the annual cost of living takes a 63% bite out of the yearly median household income, with $37,817 going to bills and financial responsibilities. Even with costly city living, that still leaves nearly $21,500 for Fort Wayne residents to spend on luxuries and save for retirement.
Find More: How Paychecks Would Look in Each State If Trump Dropped Federal Income Tax
See More: Here’s the Minimum Salary Required To Be Considered Upper-Middle Class in 2025

9. Columbus, Ohio
- Median household income: $65,327
- Annual cost of necessities: $42,297
- What’s left: $23,030
Columbus typically leaves its households with 35% of their median incomes after all the bills are paid. The city’s lower-than-average cost of living helps facilitate that, thanks to low housing costs — allowing folks to hang onto $23,030 annually.
Discover More: What Class Do You Actually Belong To? The Income Breakdown Might Shock You

8. Indianapolis
- Median household income: $62,995
- Annual cost of necessities: $39,561
- What’s left: $23,434
Due to an inexpensive housing market and low cost of living, Indianapolis offers many of its citizens a comfortable financial lifestyle in which they keep 37% of their income after taxes and bills. While 37% may not sound like much, that’s $23,434 per year to spend on whatever they choose — everything from the Indianapolis 500 to a multitude of state and city parks to a variety of museums to saving for the future.
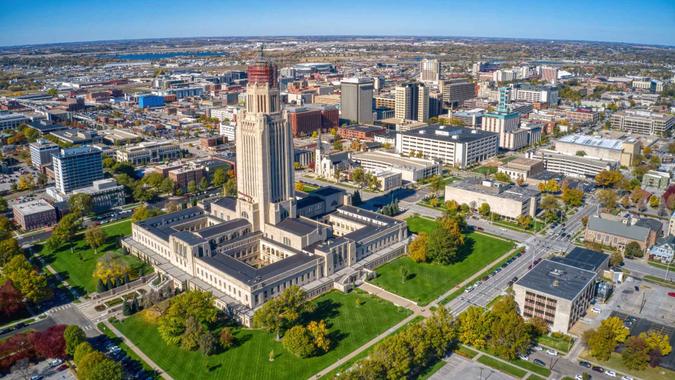
7. Lincoln, Nebraska
- Median household income: $69,991
- Annual cost of necessities: $45,151
- What’s left: $24,840
The annual cost of living in Lincoln will consume roughly 65% of the median household income there. That leaves $24,840 for the average household to play with — an amount that can go a long way in a city with low costs and low unemployment.

6. Wichita, Kansas
- Median household income: $63,072
- Annual cost of necessities: $37,405
- What’s left: $25,667
Wichita goes fairly easy on most of its residents, with only 59% going toward bills and necessities. That frees up over $25,000 per year for residents to spend and save. The city’s affordable housing market (about half the U.S. average), combined with a low cost of living, give its citizens a great deal of financial leeway.
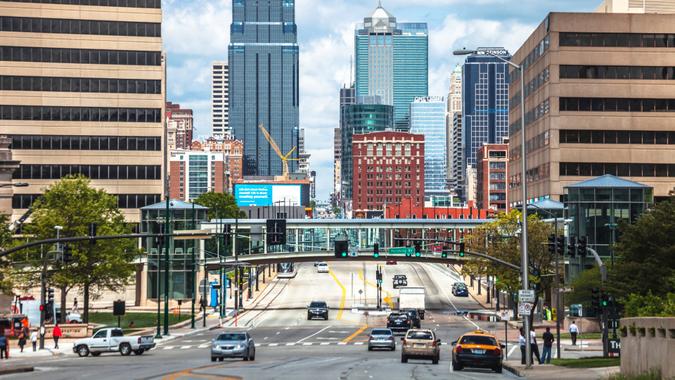
5. Kansas City, Missouri
- Median household income: $67,449
- Annual cost of necessities: $41,239
- What’s left: $26,210
Missouri is a state known for, among other things, a modest cost of living. Housing and grocery costs are low, and that gives residents the opportunity to set back a great deal of money — specifically, the 39% of the median household income that they’re able to keep per year.
Read More: Here’s the Minimum Net Worth To Be Considered Upper Class in Your 50s

4. Chicago
- Median household income: $75,134
- Annual cost of necessities: $48,127
- What’s left: $27,007
Chicago is an expensive city, yet also comes with the second-highest median household income of any metropolis on this list. That higher-than-average salary level allows Chicagoans to keep roughly $27,000 per year after the bills are paid.
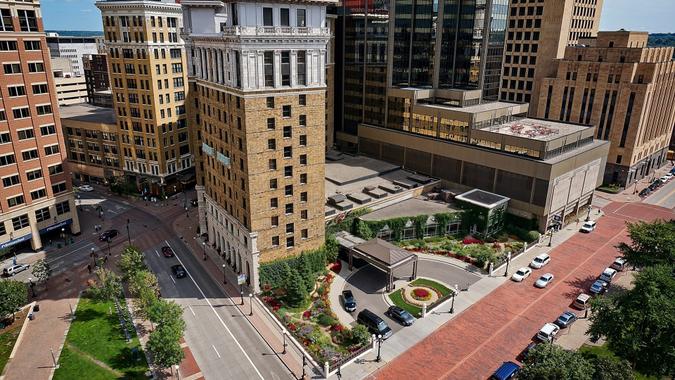
3. Saint Paul, Minnesota
- Median household income: $73,055
- Annual cost of necessities: $45,048
- What’s left: $28,007
The median household income in Saint Paul goes to a significant amount of bills — specifically, 62% gets spent on the necessities. Luckily, that fairly high income rate allows for nearly $30,000 to be left — money that can be easily saved since Saint Paul offers rent control, has a largely affordable housing market and is far cheaper than nearby Minneapolis.

2. Omaha, Nebraska
- Median household income: $72,708
- Annual cost of necessities: $44,688
- What’s left: $28,020
Omaha, in addition to low-cost housing for a big city (18% below the national average), is also bolstered with a strong job market and healthy economy. Due to those factors, citizens making the median income can still keep around $28,000 of what they earn.

1. Minneapolis
- Median household income: $80,269
- Annual cost of necessities: $48,962
- What’s left: $31,307
Despite being a more expensive city than many others in the top 10, and one that eats up 61% of the median household income, Minneapolis also provides higher incomes than comparable cities. With a median household income of $80,269, a resident can still have over $31,000 per year to squirrel away for retirement or vacations.
Methodology: For this study, GOBankingRates analyzed the top 100 cities by population, as sourced from the U.S. Census 2023 American Community Survey. Cost of living was sourced from Sperling’s BestPlaces, the average expenditure cost for all households was sourced from the Bureau of Labor Statistics Consumer Expenditure Survey. The average home value was sourced from Zillow Home Value Index; by assuming a 10% down payment and using the national average 30-year fixed mortgage rate, as sourced from the Federal Reserve Economic Data, the average mortgage was calculated. The average mortgage and expenditures were used to calculate the total cost of living for necessities in each location. Using the median household income, the leftover savings was calculated and sorted to show the largest savings first. All data was collected on and is up to date as of Aug. 18, 2025.
More From GOBankingRates
This article originally appeared on GOBankingRates.com: 10 Midwest Cities Where Your Paycheck Goes the Furthest