If you're planning your post-retirement move and looking for the cheapest places to retire, the grocery prices in these cities might make you reconsider.
Grocery prices are surging everywhere, but some cities have been hit harder than others. To figure out which places are feeling the pinch the most, I analyzed the latest grocery pricing data from the Council for Community and Economic Research to identify the 10 cities where residents are paying even more than the national average at the grocery store.
I also gathered data on median incomes for each city to estimate how much of a household's income was going toward putting food on the table, and the numbers may surprise you.
How high grocery costs stack up against expert recommendations
Financial experts typically recommend that you spend no more than 10% to 15% of your take home pay on groceries. That's your after-tax income.
Almost none of the cities below met that benchmark. Using pre-tax income data, nine out of 10 cities had average monthly grocery costs that exceeded 15% of household income — meaning the share of take-home pay going toward food is even higher.
The USDA's monthly cost of food reports outline what a balanced, nutritious diet should cost nationwide. Based on the latest USDA food plan report, a 4-person household should spend between $992.30 and $1,628.40 per month, depending on how thrifty they want to be.
But in all of the cities below, the average monthly grocery bill is closer to the USDA’s “liberal plan,” the agency’s most generous estimate for a healthy monthly food budget, than it is to the "thrifty" estimate.
See which cities made the list and how much residents are spending to keep their kitchens stocked.
Honolulu, HI

- 31.4% more expensive
- Average monthly grocery spend: $1,630
- Median household income: $102,382
- Grocery spend to income: 19.1%
Living full-time in paradise will cost you. Residents of Honolulu pay 31.4% more than the national average to eat.
On average, households earn $102,382 per year and spend $19,560 of that on groceries every year. That's 19.1% of income going toward food.
Juneau, AK

- 28.4% more expensive
- Average monthly grocery spend: $1,597
- Median household income: $99,748
- Grocery spend to income: 19.2%
Three Alaskan cities made the list for most expensive groceries, and Juneau's food bill was the highest of the three. Residents here pay 28.4% more than the national average. A typical household brings home $99,748 before tax and spends $19,164 of that on groceries.
That puts it just below Honolulu in terms of affordability, with grocery spend accounting for 19.2% of a household's income.
Anchorage, AK

- 23.7% more expensive
- Average monthly grocery spend: $1,537
- Median household income: $93,881
- Grocery spend to income: 19.6%
Alaska's capital isn't faring much better than Juneau. With prices here 23.7% higher than the national average, Anchorage residents spend $18,444 per year on groceries on average. That's 19.6% of the median household income of $93,881.
Fairbanks, AK

- 23% more expensive
- Average monthly grocery spend: $1,529
- Median household income: $86,780
- Grocery spend to income: 21.1%
Fairbanks might only have the third-most-expensive groceries in Alaska, but income here is spread thinner than it is anywhere else in the state. With a median household income of $86,780 and an average annual grocery bill of $18,348, the typical household spends 21.1% of its earnings on food.
That makes this the least affordable city for groceries in Alaska and the third least affordable city on this list – outranked only by Brooklyn, NY and Oakland, CA.
Manhattan, NY

- 16.% more expensive
- Average monthly grocery spend: $1,439
- Median household income: $101,078
- Grocery spend to income: 17%
It probably comes as no surprise that Manhattan would have higher food prices than the rest of the country. But a higher-than-average median household income helps offset that somewhat.
Here, a typical household earns $101,078 per year and spends $17,268 of that on groceries. That's 17.% of income going toward food — not as bad as many of the other cities on this list, but still above the 15% recommendation.
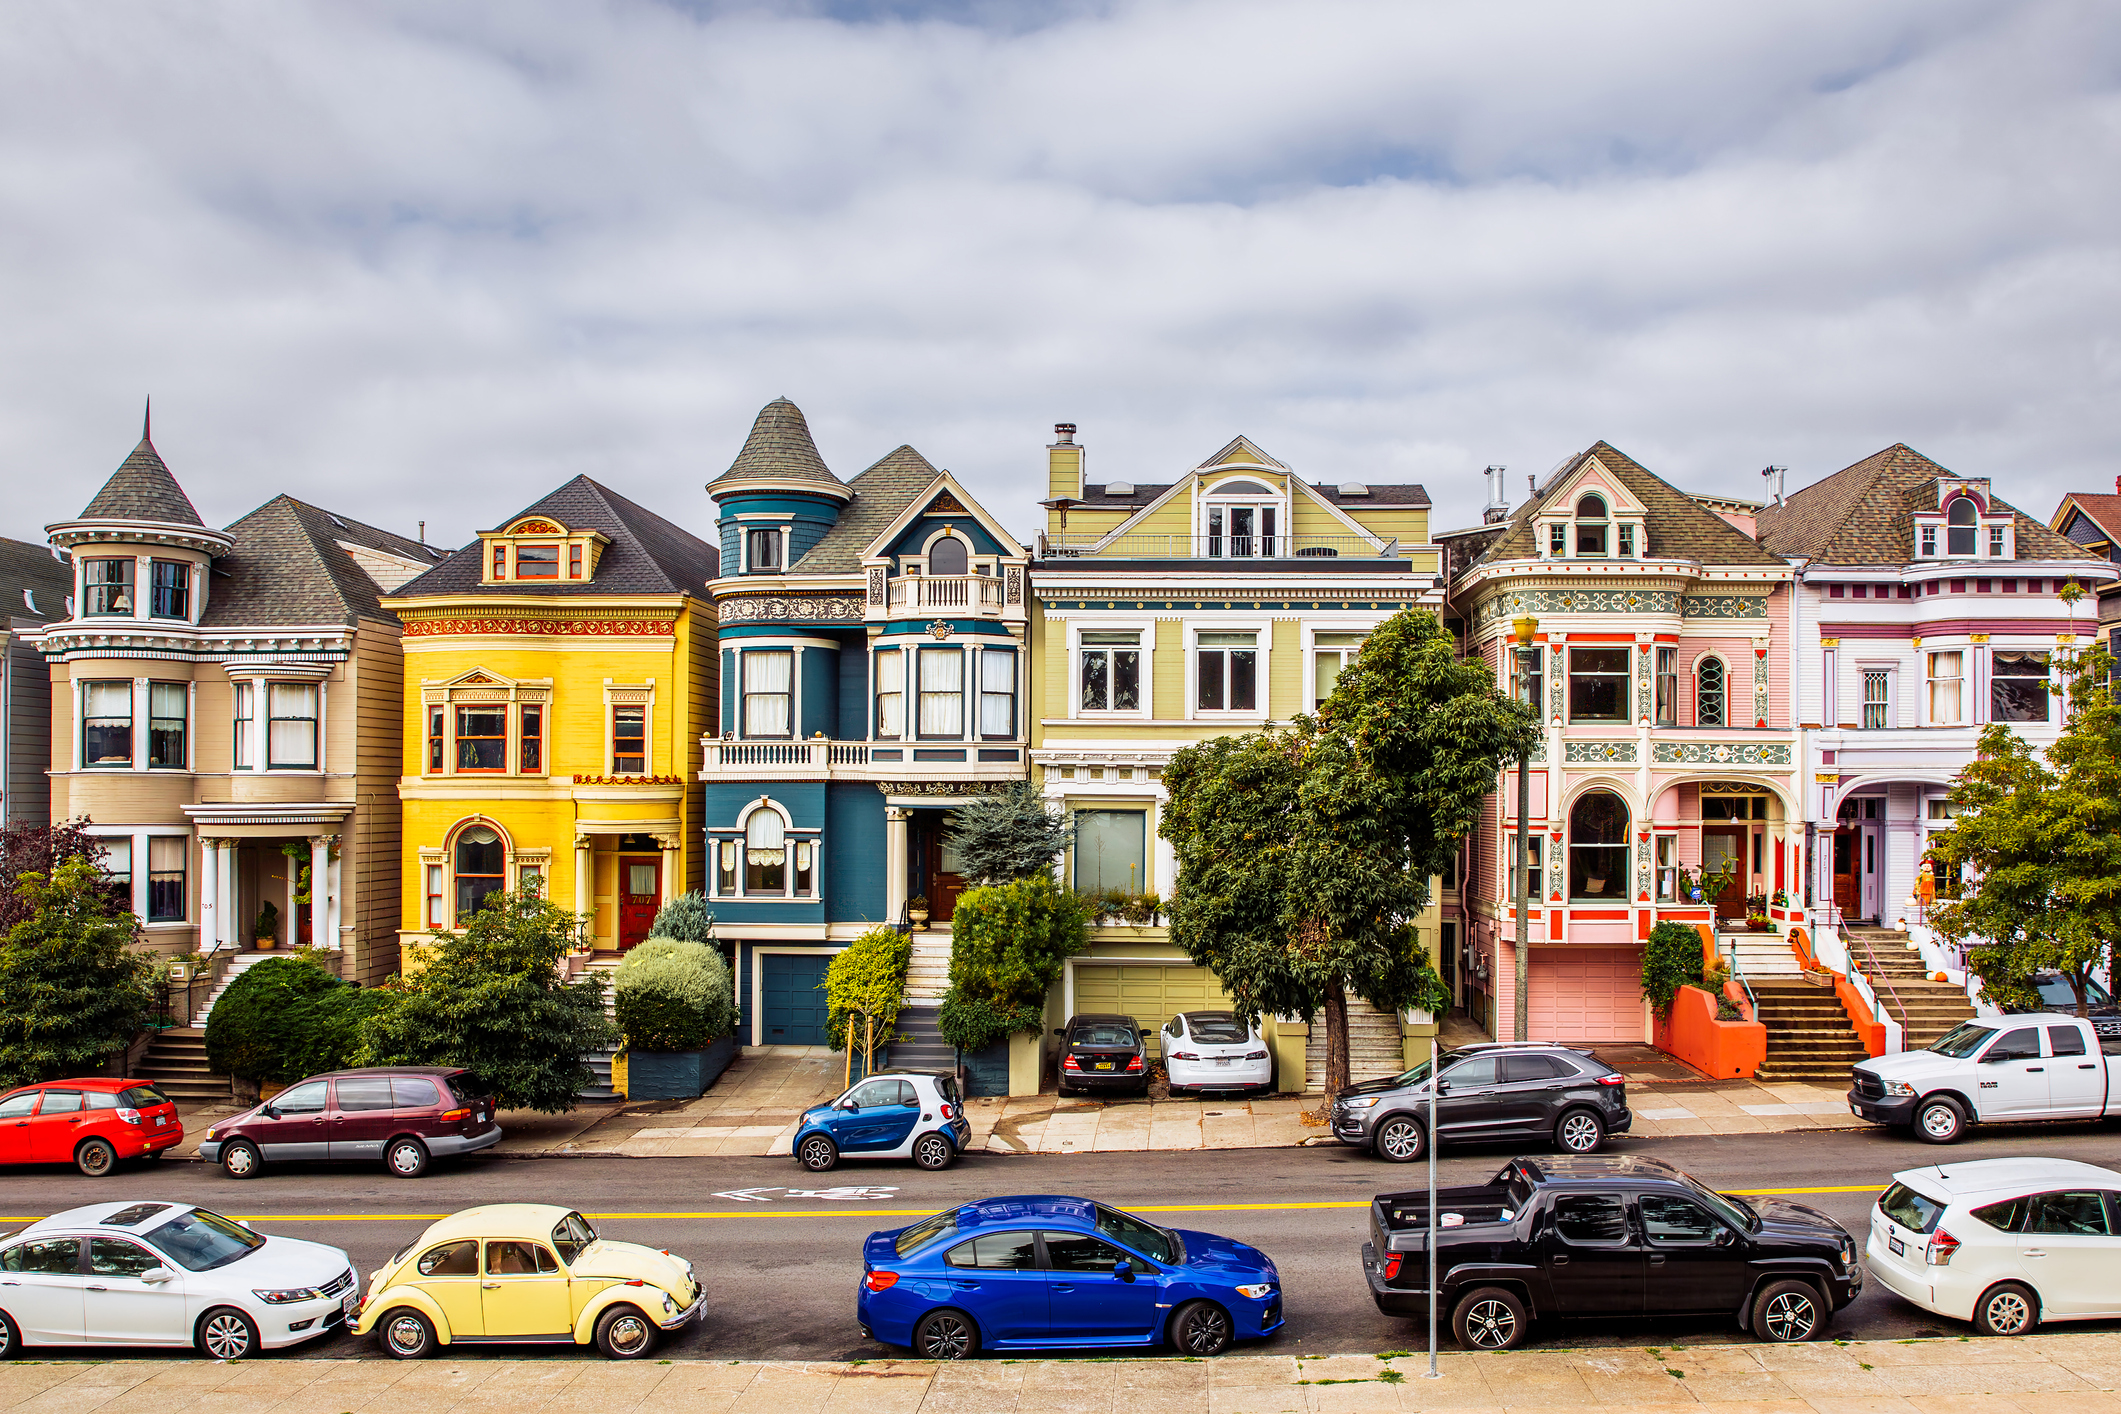
San Francisco, CA

- 15.4% more expensive
- Average monthly grocery spend: $1,432
- Median household income: $125,456
- Grocery spend to income: 13.7%
San Francisco wouldn't be most people's first thought when it comes to "affordable." Indeed, it is one of the most expensive cities to live in. But when you compare the average grocery spend to the median income in the city by the bay, the typical household spends just 13.7% of its earnings to keep the fridge stocked.
That makes it the only city on this list where a household earning the median income for the region can follow the recommendation to spend 15% or less of their budget on food.
Brooklyn, NY

- 15.1% more expensive
- Average monthly grocery spend: $1,424
- Median household income: $76,912
- Grocery spend to income: 22.2%
While Brooklyn residents technically spend a little less per month on groceries than their Manhattan neighbors, the dramatically lower median household income means groceries are far less affordable here, despite the slightly lower price tag.
With a typical household spending 22.2% of its income on food, it's the second least affordable city in the United States when it comes to keeping your family fed.
Queens, NY

- 13.7% more expensive
- Average monthly grocery spend: $1,408
- Median household income: $81,399
- Grocery spend to income: 20.7%
In Queens, households pay 13.7% more than the national average for groceries, spending $16,896 per year to put food on the table. With a median household income of $81,399, groceries take up 20.7% of a household's budget in Queens.
Their wallets might not be quite as strained as their Brooklyn neighbors', but they're definitely feeling the pinch more than the typical Manhattan household.
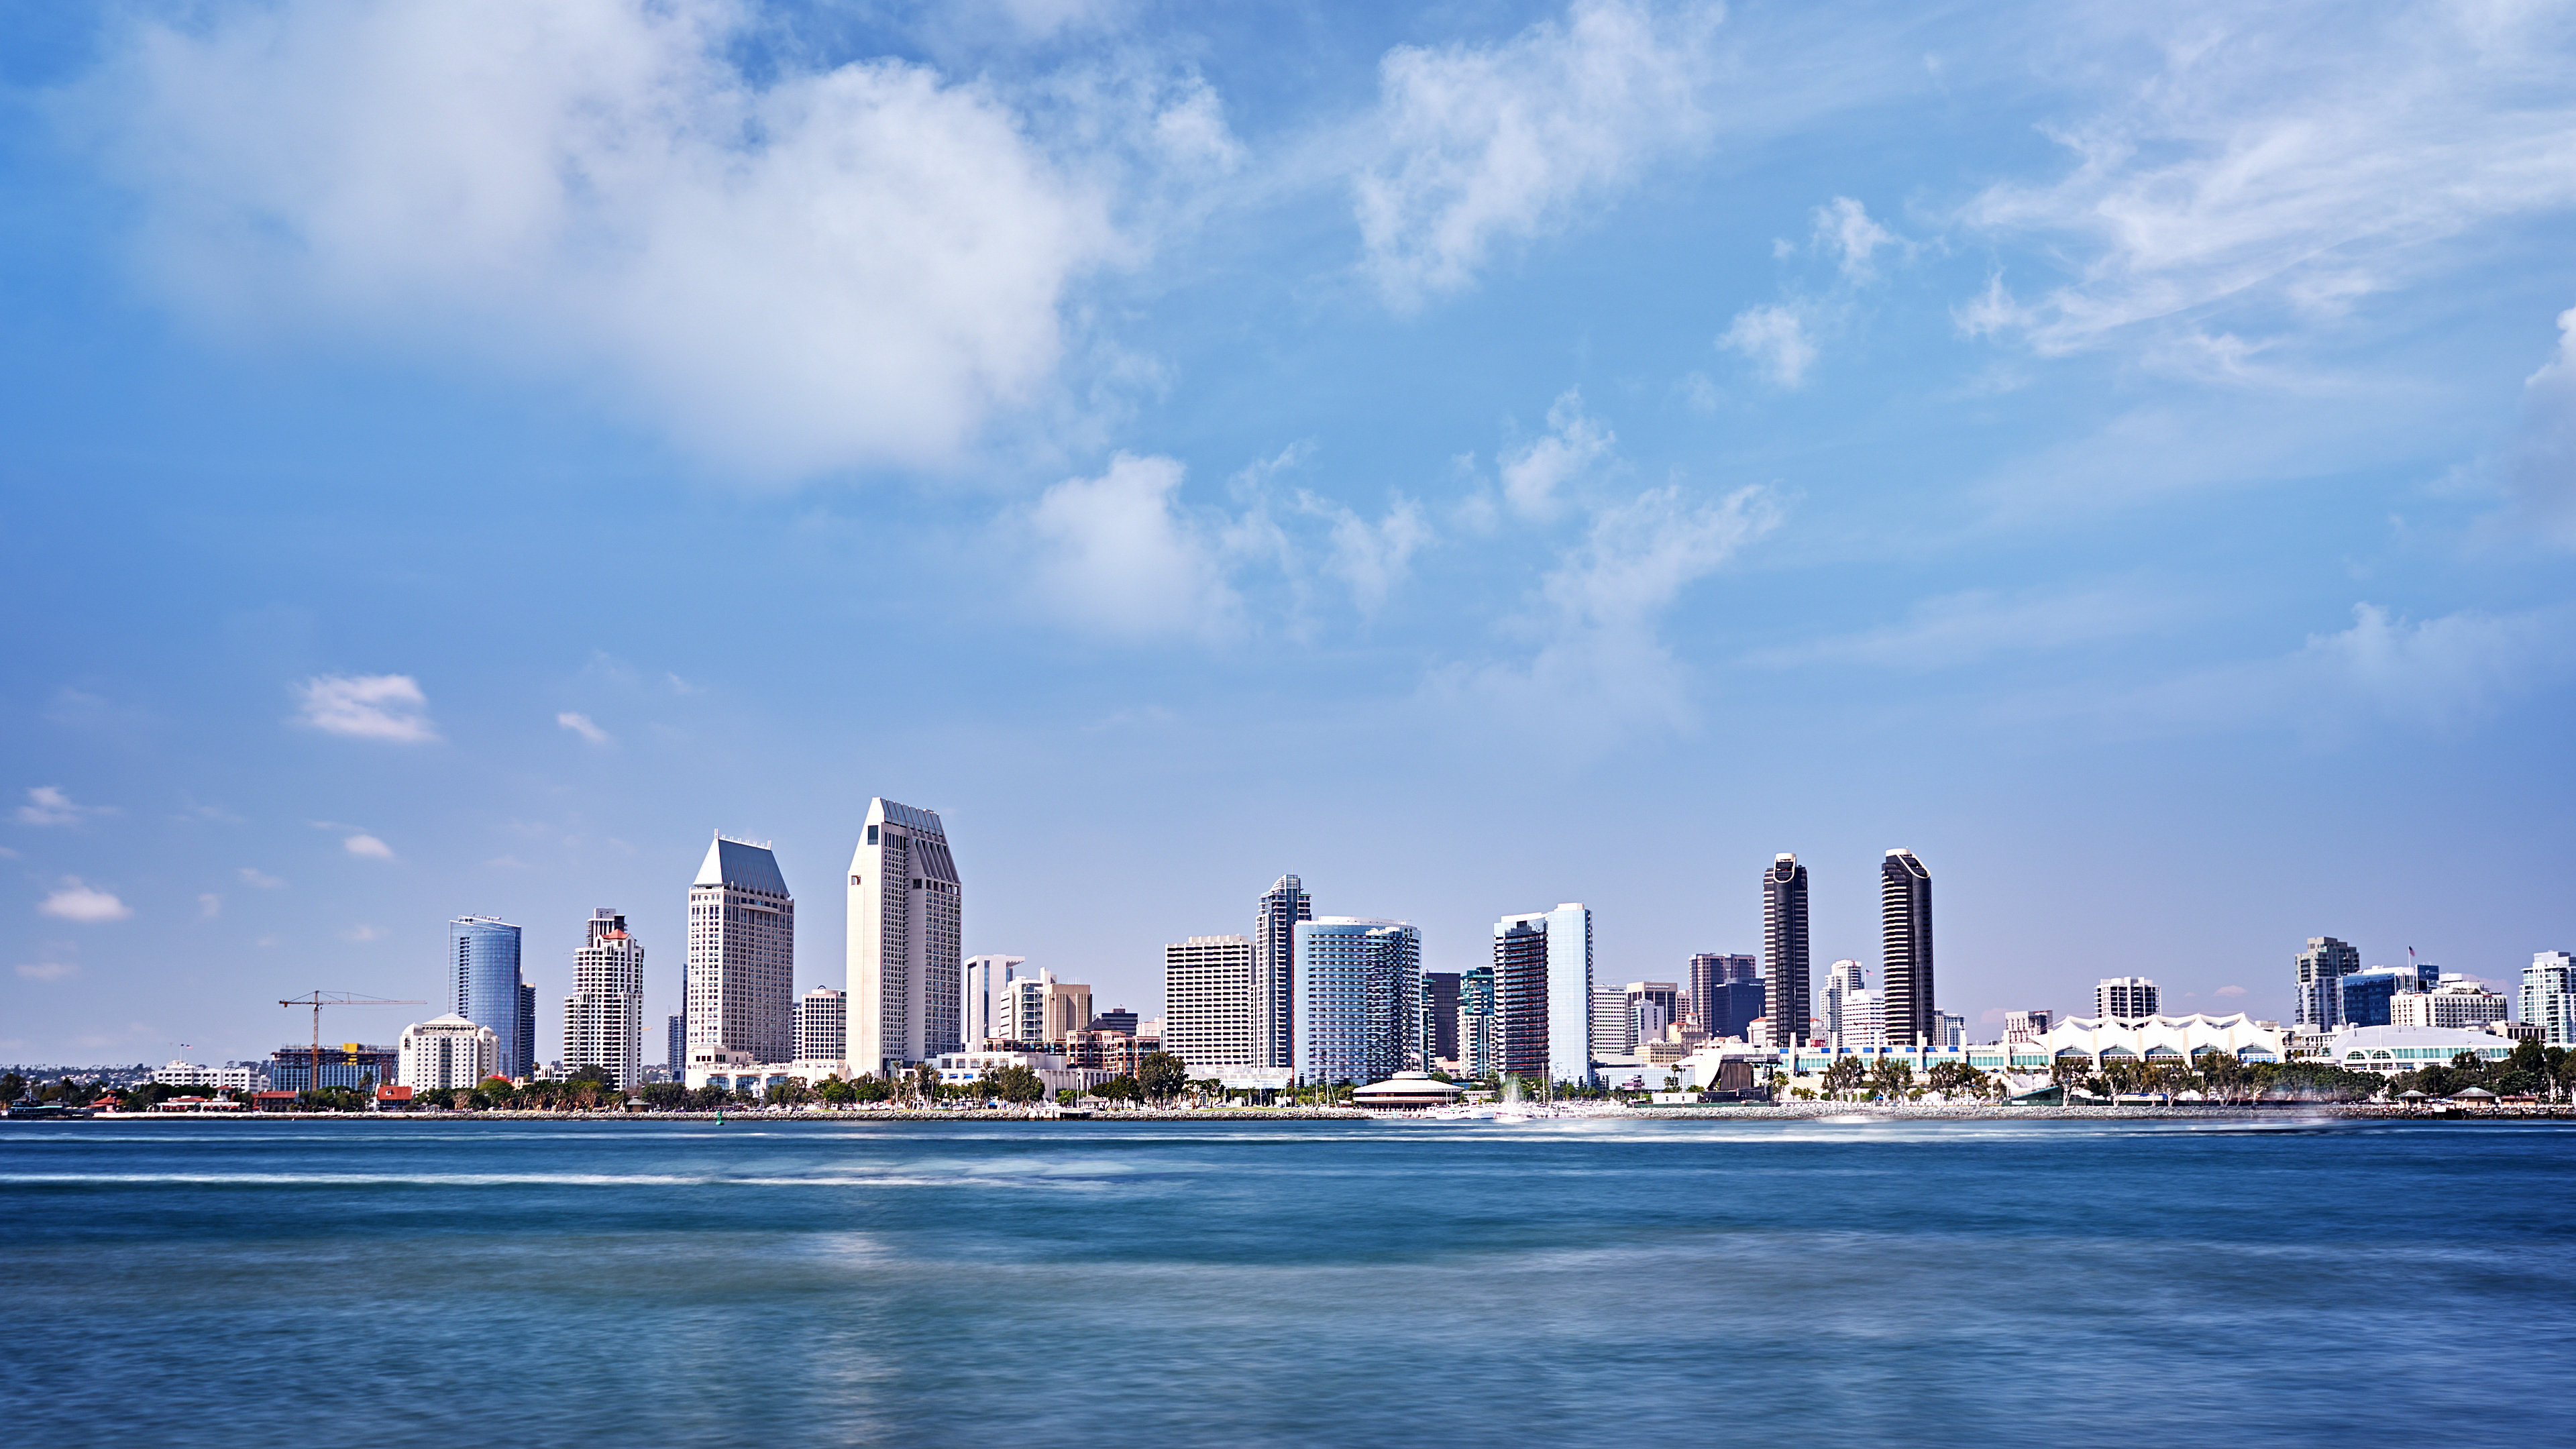
San Diego, CA

- 12.3% more expensive
- Average monthly grocery spend: $1,395
- Median household income: $103,476
- Grocery spend to income: 16.2%
Surf's up and so are grocery prices in San Diego. Residents here see price tags that are 12.3% above the national average. Fortunately, they also enjoy one of the higher median household incomes among the cities on this list.
When factoring in their income, a San Diegan household spends just 16.2% of their budget on food. That's almost in line with expert recommendations of 10% to 15%.
Oakland, CA

- 11.9% more expensive
- Average monthly grocery spend: $1,388
- Median household income: $73,200
- Grocery spend to income: 22.8%
San Francisco might stand out for the "affordability" of groceries, but its neighbor to the east tells a different story. At 11.9% above the national average, prices are technically cheaper in Oakland than they are in San Francisco.
But when you factor in the significantly lower median household income of $73,200, the cost to keep a household fed takes up 22.8% of that income. In terms of relative affordability, then, Oakland residents rank lowest among the cities on this list – meaning groceries are the least affordable here.


