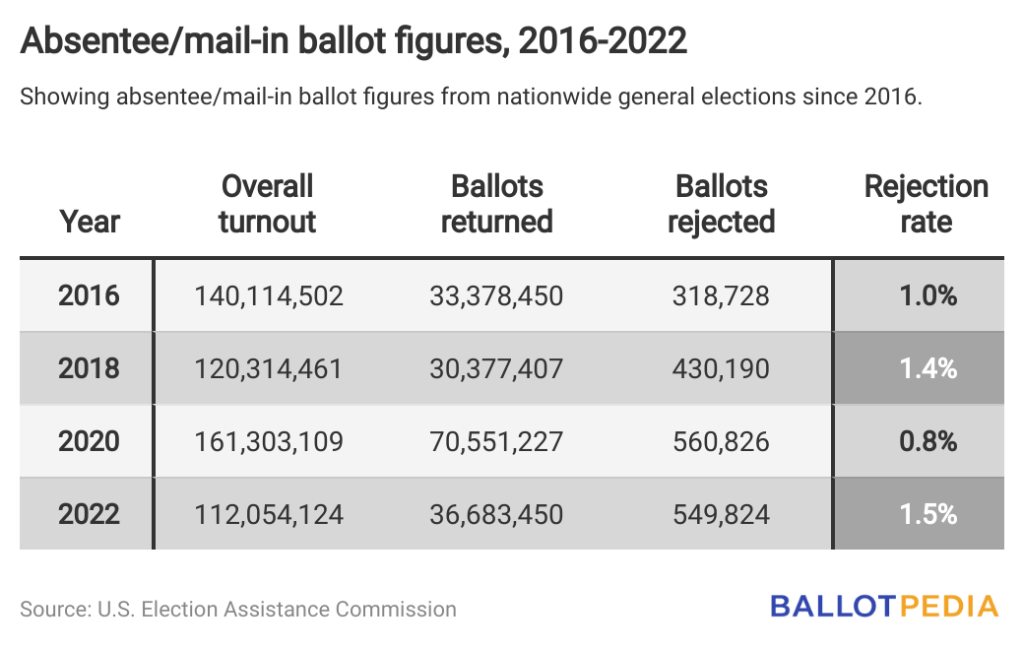
Voters cast 36,683,450 absentee/mail-in ballots in the 2022 general election. Of that total 549,824—or 1.5%—were rejected, roughly equal to the 1.4% rejection rate in 2018, the most recent midterm election, and up from the 1.0% and 0.8% rejection rates in the 2016 and 2020 presidential election cycles, respectively.
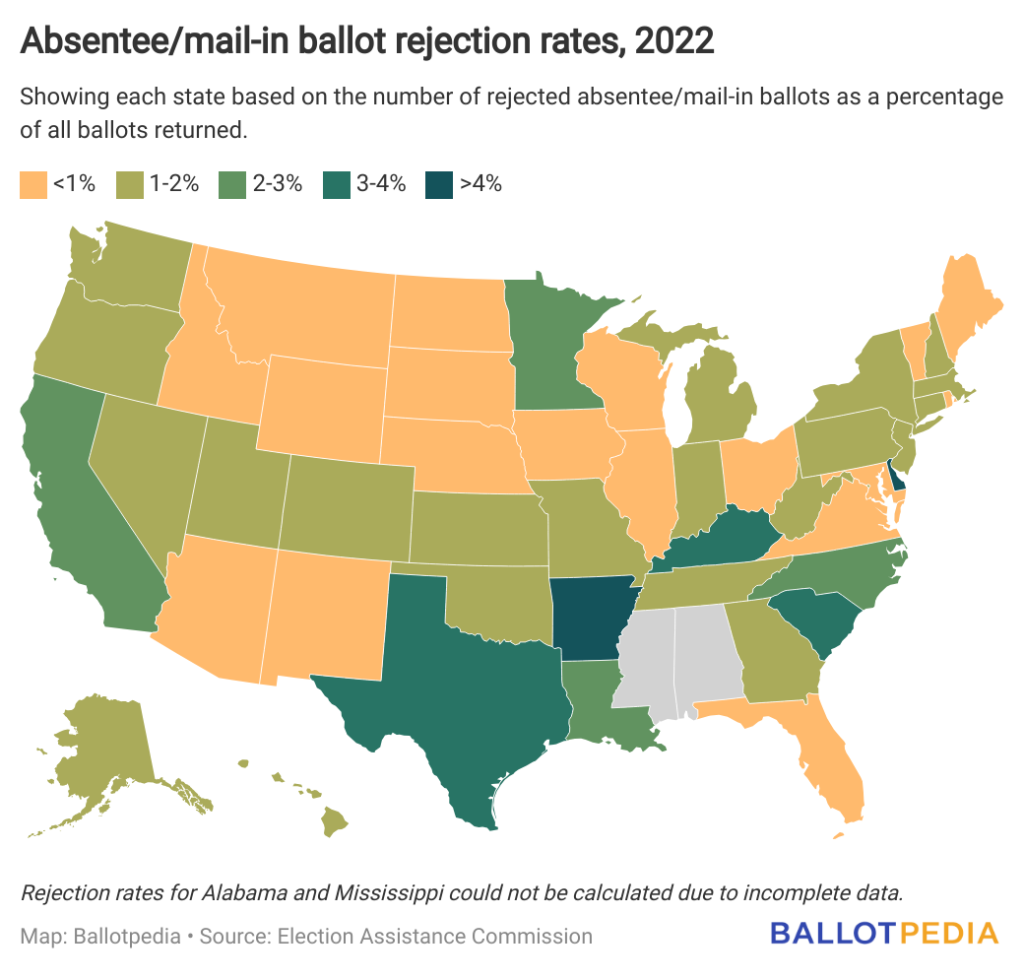
Between the midterm election cycles in 2018 and 2022, the absentee/mail-in ballot rejection rate increased in 17 states. It decreased in 31, and Washington, D.C. Comparative data was unavailable for Alabama and Mississippi.
This data comes from the U.S. Election Assistance Commission’s (EAC) biannual Election Administration and Voting Survey released last June. Under the Help America Vote Act, the EAC must compile a report after every even-year election cycle detailing election statistics and policy figures. The EAC does not conduct its own research but rather aggregates survey responses from election officials across the country.
Delaware had the highest rejection rate in 2022, at 13.2%, up from 5.0% in 2018 and 1.3% in 2020.
The EAC does not hypothesize why Delaware’s rejection rate increased. But it notes that election officials rejected roughly 86% of these ballots for some reason other than a missing signature, missed deadline, or issue with the return envelope.
Delaware requires voters to have a valid excuse in order to request an absentee/mail-in ballot. Legislators attempted to change state law to allow any voter to cast such a ballot in 2022. The state supreme court declared those changes unconstitutional one month before the general election.
Arkansas (6.8%), Texas (3.4%), Kentucky (3.3%), and South Carolina (3.2%) followed with the highest rejection rates in 2022.
Idaho had the lowest rejection rate, at effectively 0.0%. The state reported rejecting one absentee/mail-in ballot in Fremont County. One other county, Camas, reported no rejections, while the state’s remaining 42 counties indicated they lacked rejected ballot data.
Vermont (0.1%), Iowa (0.2%), Ohio (0.3%), and South Dakota (0.4%) followed with the year’s lowest rejection rates.
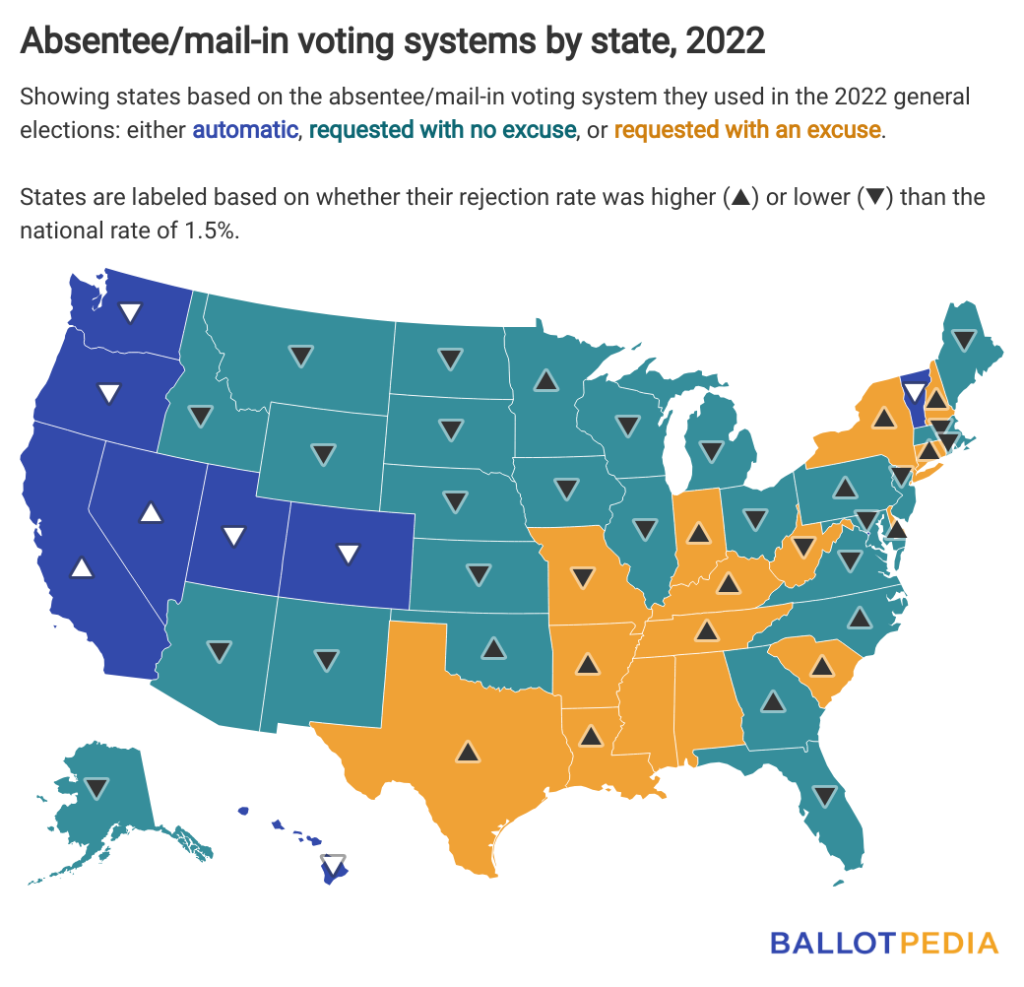
Every state allows for some form of absentee/mail-in voting, which allows voters to cast a ballot outside of in-person voting on Election Day.
But different states have different rules over who can vote by mail and how. There are three broad categories:
- Automatic systems, where every voter receives an absentee/mail-in ballot automatically;
- Request-required with no excuse, where every voter can request an absentee/mail-in ballot; and,
- Request-required with an excuse, where only certain voters can request an absentee/mail-in ballot if they have a valid excuse.
In 2022, eight states and Washington, D.C., used automatic systems, 27 states used request-required with no excuse, and 15 states used request-required with an excuse.
Higher rejection rates were more common in states that require an excuse to vote by absentee/mail-in ballot. Eleven of those states had rates exceeding the national rate (1.5%), compared to two with lower rates.
Lower rejection rates were more common in states where any voter can request an absentee/mail-in ballot. Twenty-two of those states had rates lower than the national rate, compared to five with higher rates.
In states with automatic systems, three and D.C. had rejection rates above the national rate, and six had lower rejection rates.
The EAC asks states to provide reasons for each rejected ballot, if available, using a pre-selected list of topics like a missed deadline, non-matching signature, or problems with return materials.
In 2022, the most common reason was other reason not listed, accounting for 33% of all rejected ballots. This includes all reasons apart from those specified in the EAC’s survey.
Similarly, in 2018, the most common reason was also other, accounting for 35% of all rejections.
In the 2016 and 2020 presidential election cycles, the most common reason was a non-matching signature, accounting for 33% and 28% of all rejections, respectively. This means the signature on the absentee/mail-in ballot did not match the signature election officials had on file for the voter, used to ensure the person filling out the ballot is the voter who requested the ballot.
You can learn more about the EAC’s methodology here and can read the full 2022 report here.
Learn More