
Earnings season has been heating up. Tesla and Google both reported earlier this week, and Intel Corp. (NASDAQ:INTC) posted its own print after the close yesterday.
This one matters beyond Intel itself. It was the first major AI/semi ticker to report this week, and the sector has been rolling over lately – most AI/semi names are 20 to 40% off their yearly highs. How Intel reacts could set the tone for the rest of the group.
I ran INTC through the implied move projections, option positioning, and price action heading into the print to see what the options market was pricing in – and what it means for the broader AI trade now that the numbers are out.
Implied Move Projections for INTC
Heading into the print, the market was pricing in roughly a 12.67% move in either direction. IV for the expiry covering earnings was running at 285.9%, versus annualized IV of 104% – a 185-point gap.

With spot price at $99.69 before the print, a $13 move projected an upside target around $112 and a downside target around $87.
The real question was whether option positioning could hold those barriers.
Option Positioning on INTC
Looking at the GammaLens data heading into the print, price around $100 sat at the TPS (Top Put Strike). $110 was the TGS (Top Gamma Strike), and $120 was the TCS (Top Call Strike).
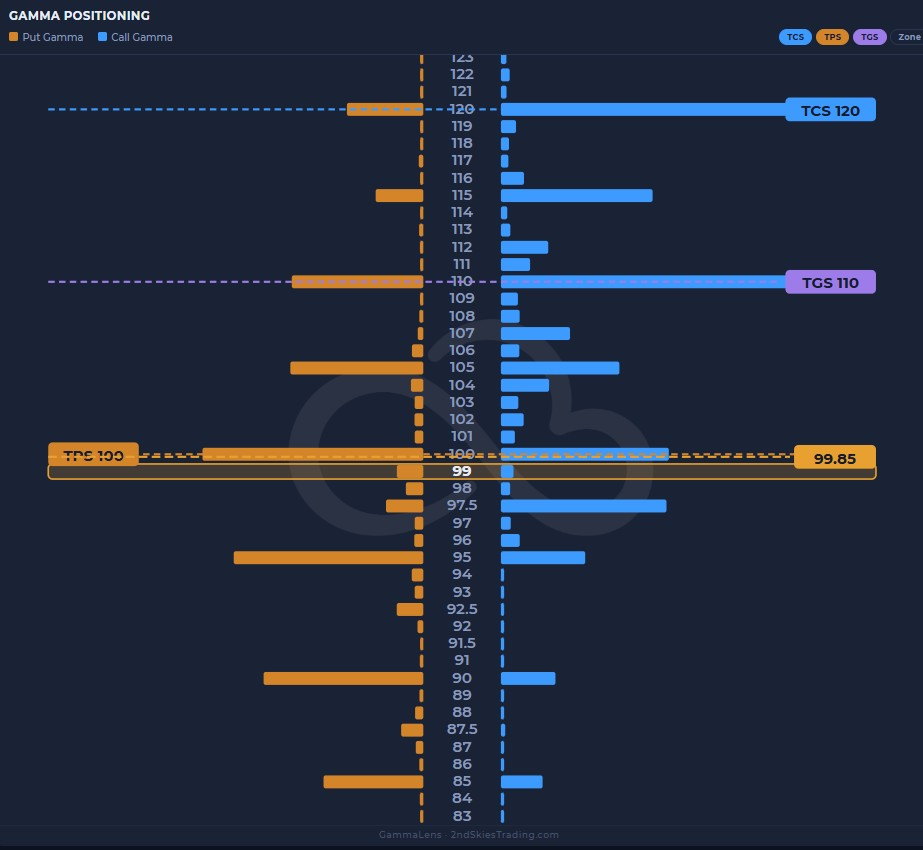
A $12 to $13 move to the upside would put price just above the TGS, which can act as a strong magnet. $120 was the aspirational target for bulls on a really strong print.
To the downside, that same move projected around $87, with $90 as solid support and $85 just below. Overall, positioning supported a move beyond the implied range in either direction – meaning a stronger than expected beat or miss likely wasn’t going to get contained by these levels.
Price Action on INTC – and What It Means for AI
On the 4-hour chart heading into the print, INTC had posted a recent series of lower highs, with the prior week’s lows producing a lower low as well.
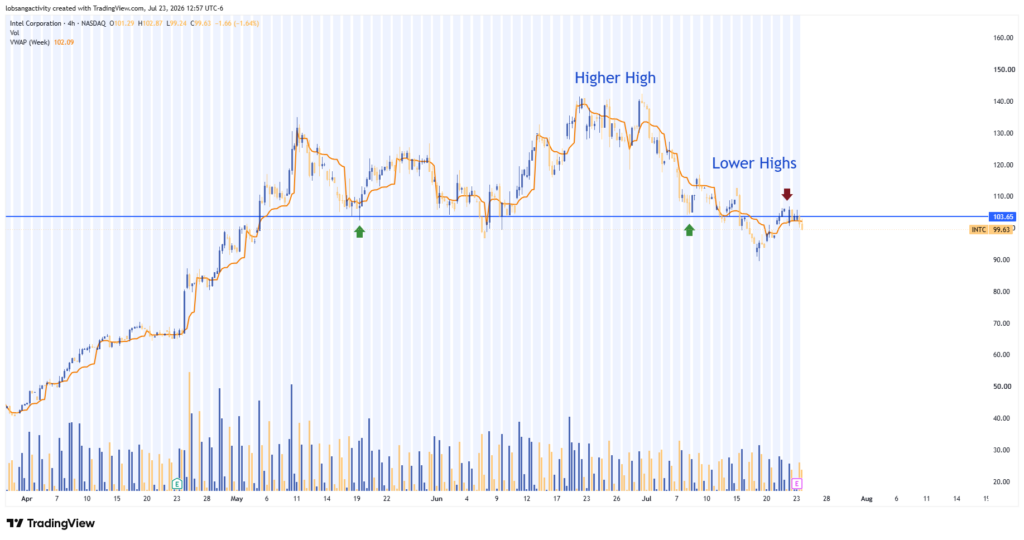
The most recent bounce had stalled around $100 to $105, and the market looked like it was rolling over. The lows from July 17th sat just under $90 – a bearish result from earnings could easily test those levels. A close below them would likely trip technical stops and open up fresh downside.
The bigger picture: this week’s earnings haven’t been great, with both TSLA and GOOGL down from their prints. Intel was the first major AI/semi name to report this week, and how it trades in the aftermath will likely weigh on the broader AI trade, which has already been rolling over.
AMD is the exception, holding up relatively well and sitting close to its yearly highs. But most AI/semi tickers are 20 to 40% off theirs, and without a strong showing from this round of earnings, I suspect those highs don’t get recaptured this year.
I’m live every Monday through Friday, 9am-2pm EST in the Benzinga Options School, covering INTC and the AI tickers moving heavily every day.