Is the crackdown of the crackdown of sticky substances working? In a word, yes. But like spin rates themselves, there is more intrigue beneath the surface.
First, a refresher on the policing of spin. In May 2021, with the MLB batting average down to an all-time low of .236, the league announced a crackdown effective June 1 on pitchers using sticky substances as a performance enhancer to generate more spin. The use of Spider Tack and such gooey grip aids had grown so ridiculous that players could hear pitches ripping off the sticky fingers of pitchers, like Velcro. The crackdown worked immediately. The batting average in June rose to .246.
But over time pitchers learned how to work around what were mainly predictable, cursory checks by umpires. By the second half of last season, spin rates climbed again. MLB took note and announced for this season another crackdown, this one with more vigorous checks. That crackdown is working. It’s not because it led to the ejection and suspension of Mets pitcher Max Scherzer. It’s because four-seam spin rate this year is slightly below where it was last August and September.
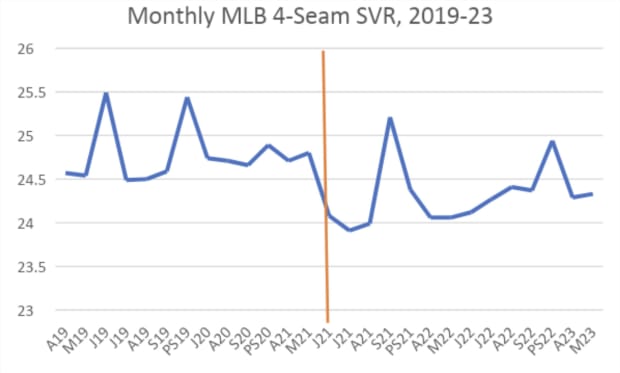
Here are the monthly four-seam spin rates since 2019, including postseasons:
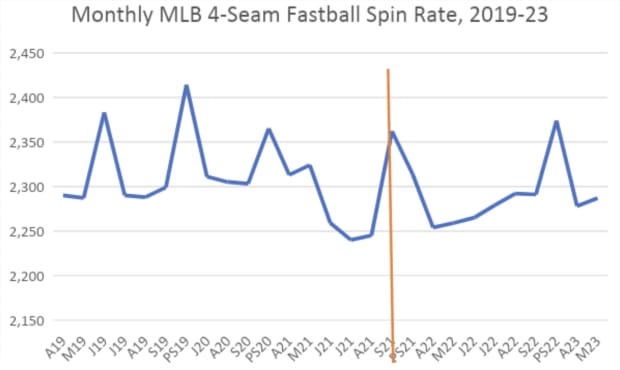
Tom Verducci/Sports Illustrated
This is what you can interpret from it:
- The orange line in the middle marks the start of the first crackdown. You can see how spin rate has dropped overall. It’s a clear before-and-after effect.
- Each postseason shows a spike, which correlates with a spike in velocity you should expect as only the best teams remain, and they use only their best pitchers.
- You see the climbing rates in August and September last season that drew the concern of MLB.
There’s more to it. Spin rate alone doesn’t tell the full story. Because spin tends to go up as velocity goes up, you need to look at spin-to-velocity ratio, or SVR. The average four-seamer in April 2019, for instance, was 93.2 mph. In May it is up to 94.0 mph, matching last September as the highest in a regular-season month in recorded history.
Here are the monthly four-seam SVR rates since 2019:
Tom Verducci/Sports Illustrated
The SVR chart follows a similar pattern to the spin chart, with the same postseason spikes (and a jump in September 2021). The first crackdown put a damper on cheating. The second one this year has curbed the growth that was evident in the second half of last season.
MLB keeps an even closer tab on spin rates than the above charts. Michael Hill and Raul Ibanez, MLB’s senior vice presidents of on-field operations, use rolling 14-day looks of SVR to monitor spin rates. (MLB prefers to call it spin-to-speed ratio.) The charts they use look like this:
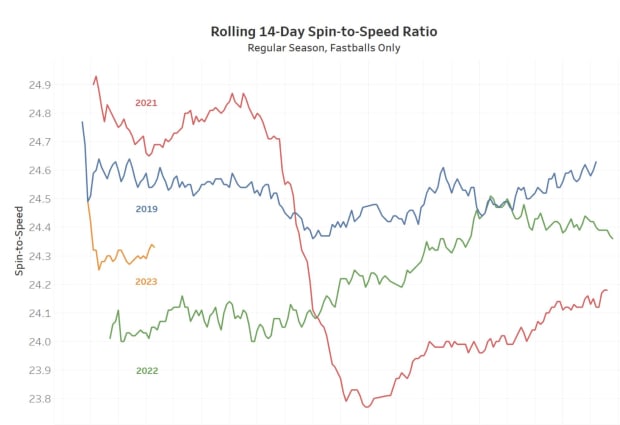
Tom Verducci/Sports Illustrated
Again, you can see the immediate impact of the 2021 crackdown, the resurgence of spin in the second half of 2022 and the slight decrease this year. MLB is satisfied with the protocols umpires use this season to check pitchers and has no plans to change them as it continues to monitor the rolling 14-day reports, according to a league spokesperson.
How much has the crackdown changed the game? It might not seem like much when you compare spin rates before and after the crackdown—just 31 rpms on average:
| Dates | MPH | RPM | SVR |
|---|---|---|---|
April 2019-May 2021 |
93.4 |
2,298 |
24.60 |
June 2021-May 2023 |
93.8 |
2,267 |
24.17 |
But think about pitchers using sticky stuff like people speeding in their cars. Not everybody is on the wrong side of the law. And many are so barely over the established limit that prevailing culture does not regard such behavior as punishable.
This is about the dude traveling 55 mph in a school zone or testing jet fuel in his sports car on the highway. What the crackdown has done is put barriers up against flagrancy when there had been none. The effect of the two crackdowns is best seen at the top of the spin rate environment, not the average:
| Dates | Overall | FB w/2,900+ RPM |
|---|---|---|
April 2019-May 2021 |
434,634 |
1,057 |
June 2021-May 2023 |
456,201 |
146 |
The super-spinning four-seamers have been cut by 86%.
Now a look at the individual super-spin fastball leaders:
| Dates | Pitcher | Fastballs |
|---|---|---|
April 2019-May 2021 |
Trevor Bauer |
214 |
June 2021-May 2023 |
Tyler Rogers |
12 |
Trevor Bauer threw more super-spin fastballs in the 11 regular-season months before the crackdown (214) than 1,008 pitchers combined have thrown in the 11 ½ regular season months since the crackdown (146).
So, yes, the crackdown is working, especially to combat the super-spin excesses. Mix the second sticky stuff crackdown with a ban on shifts and you get a rise in batting average for the first time in four years—to .247. It is a better game. More importantly, it’s a fairer game.